|

EUR/JPY Price Analysis: Further consolidation looks likely near-term

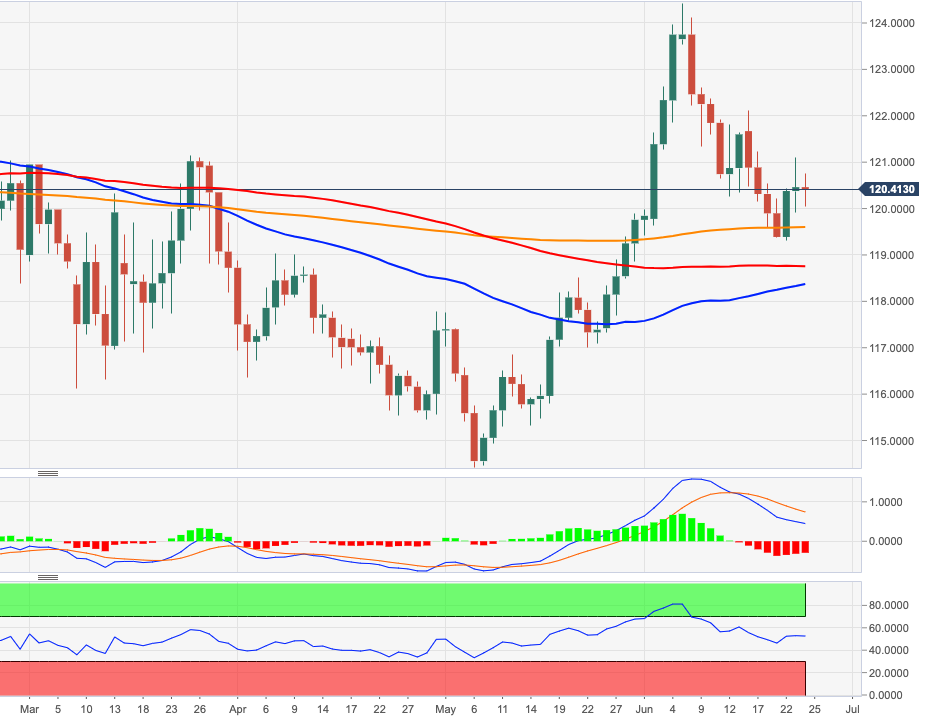
  • EUR/JPY met resistance in the 121.00 neighbourhood so far this week.
  • Immediately to the upside emerges the next stop at the 122.00 barrier.

Following a failed attempt to surpass the 121.00 mark on Tuesday, EUR/JPY is now shedding some ground and returns to the 120.40 area at the time of writing.

In the meantime, solid support appears to have emerged at the 200-day SMA in the mid-119.00s. A break below this area should pave the way for a deeper pullback in the near-term.

In the meantime, while above the 200-day SMA, the outlook on the cross is expected to remain positive.

EUR/JPY daily chart

EUR/JPY

Overview
Today last price120.33
Today Daily Change71
Today Daily Change %-0.11
Today daily open120.46
 
Trends
Daily SMA20120.99
Daily SMA50118.35
Daily SMA100118.76
Daily SMA200119.6
 
Levels
Previous Daily High121.1
Previous Daily Low119.91
Previous Weekly High122.12
Previous Weekly Low119.38
Previous Monthly High119.9
Previous Monthly Low114.43
Daily Fibonacci 38.2%120.64
Daily Fibonacci 61.8%120.36
Daily Pivot Point S1119.88
Daily Pivot Point S2119.3
Daily Pivot Point S3118.69
Daily Pivot Point R1121.07
Daily Pivot Point R2121.68
Daily Pivot Point R3122.26

Author

Pablo Piovano

Born and bred in Argentina, Pablo has been carrying on with his passion for FX markets and trading since his first college years.

More from Pablo Piovano
Share:

Editor's Picks

EUR/USD: Breakdown below trading range support near 1.1770 comes into play

The EUR/USD pair opens with a bearish gap at the start of a new week as the US-Iran war-led global flight to safety boosts the US Dollar. Spot prices, however, lack follow-through selling and manage to hold above mid-1.1700s during the Asian session.

GBP/USD targets 1.3500 barrier near moving averages

GBP/USD rebounds from the daily losses, trading around 1.3450 during the Asian hours on Monday. The technical analysis of the daily chart indicates an ongoing bearish bias, as the pair trades within a descending channel pattern.

Gold jumps over 2% toward $5,400 after US, Israel attack Iran

Gold is on fire at the start of the week, a widely expected move, as investors seek harbor in the traditional store of value, following the continued US and Israel attacks on Iran. The bright metal opened with a bullish gap of about $17 and rallied toward the $5,400 level as Asian traders hit their desks and reacted negatively to the weekend news of the Middle East conflict, rushing for cover in Gold.

Top Crypto Losers: Tezos, Toncoin, and Polkadot at crucial levels amid US-Israel strike on Iran

Altcoins such as Tezos, Toncoin, and Polkadot rank among the worst hit cryptocurrencies over the last 24 hours amid the US and Israel's attack on Iran. Tezos and Toncoin are down to crucial support levels while Polkadot remains near a crucial resistance trendline, showcasing underlying strength.

The market is paying for insurance, not apocalypse

As expected, this morning felt less like a Monday market open and more like a fire drill. Futures screens flickered red. S&P contracts down almost 1%. Nasdaq off 1.2%. Brent leaped 13% through $80. Gold rose 1.6% toward $5350 before paring some gains. The dollar is strutting mildly. The Swiss franc is quietly doing what it always does in a storm, catching some safe-haven flows.

Starknet unveils strkBTC, shielded Bitcoin transactions on Ethereum Layer 2

Starknet, the Ethereum Layer 2 network developed by StarkWare, today announced strkBTC, a wrapped Bitcoin asset that introduces optional shielding while preserving full DeFi composability.