|

EUR/JPY Price Analysis: Fluctuates around 144.60s after piercing the 20/50-day EMAs

  • The EUR/JPY is recovering from Tuesday’s losses and rose 0.38% on Wednesday.
  • EUR/JPY: Break above 145.30s could pave the way for further gains.

The EUR/JPY erases some of Tuesday’s losses and clings to gains above the psychological 144.00 figure, after a volatile trading session in Wall Street, following the US Federal Reserve (Fed) decision to hike rates by 50 bps. As the Asian Pacific session begins, the EUR/JPY is trading at 144.60.

EUR/JPY Price Analysis: Technical outlook

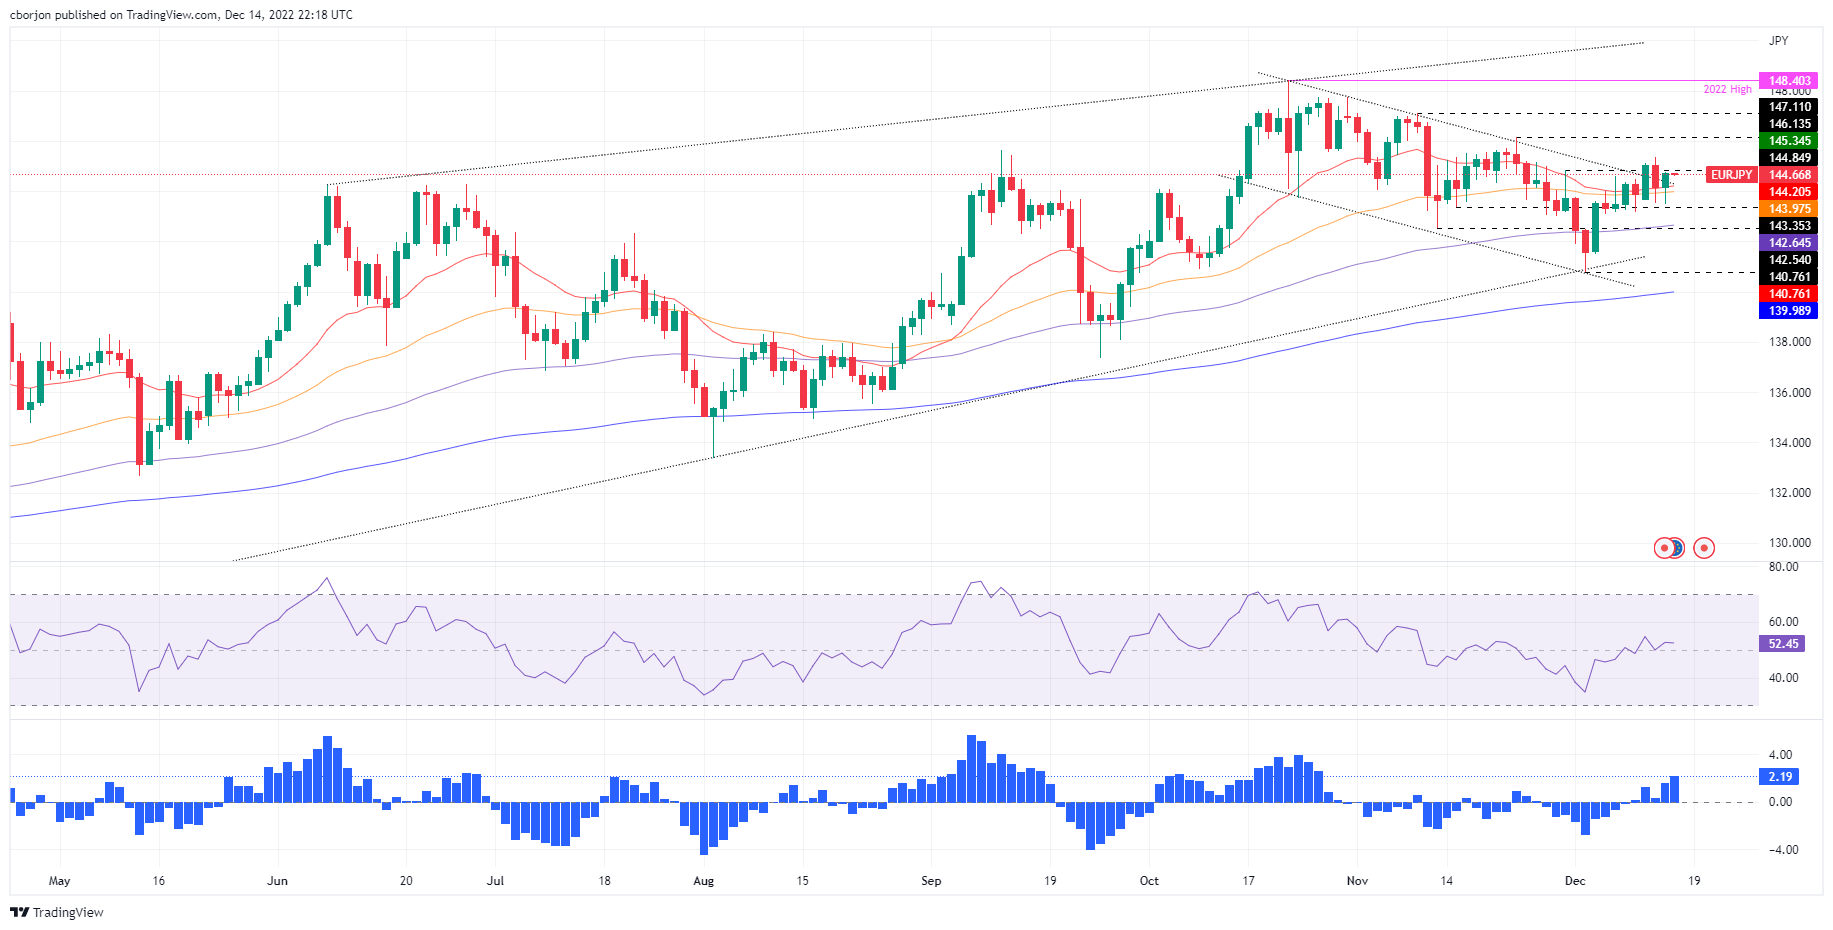
The EUR/JPY daily chart suggests the cross is slightly upward biased, though with some risks skewed to the downside. For the cross to extend its weekly gains, the EUR/JPY needs to clear the weekly high reached on December 14 at around 145.34, which would exacerbate a rally toward the November 23 pivot high at 146.13. Once cleared, the next resistance would be the November 9 daily high of 147.11.

EUR/JPY’s failure to clear the weekly high could pave the way for consolidation and a fall toward the week’s lows. The EUR/JPY key support levels would be the 20-day Exponential Moving Average (EMA) at 144.20, followed by the 50-day EMA at 143.97. A breach of the latter would be crucial, exposing 143.17, the current week’s low, which, once removed, will drag prices toward the 100-day EMA at 142.64.

From a momentum point of view, the Relative Strength Index (RSI) suggests that neither buyers/sellers are in charge, with RSI almost flat, nearby 50. However, the Rate of Change (RoC) suggests that buyers are gathering momentum. Therefore, further EUR/JPY upside is expected.

EUR/JPY Key Technical Levels

EUR/JPY

Overview
Today last price144.60
Today Daily Change0.55
Today Daily Change %0.38
Today daily open144.15
 
Trends
Daily SMA20144.13
Daily SMA50144.73
Daily SMA100142.05
Daily SMA200139.71
 
Levels
Previous Daily High145.35
Previous Daily Low143.52
Previous Weekly High144.58
Previous Weekly Low141.44
Previous Monthly High147.12
Previous Monthly Low142.56
Daily Fibonacci 38.2%144.22
Daily Fibonacci 61.8%144.65
Daily Pivot Point S1143.33
Daily Pivot Point S2142.52
Daily Pivot Point S3141.51
Daily Pivot Point R1145.16
Daily Pivot Point R2146.16
Daily Pivot Point R3146.98

Author

Christian Borjon Valencia

Markets analyst, news editor, and trading instructor with over 14 years of experience across FX, commodities, US equity indices, and global macro markets.

More from Christian Borjon Valencia
Share:

Editor's Picks

EUR/USD slumps below 1.1750 as USD benefits from risk-aversion

EUR/USD comes under renewed bearish pressure in the European session and trades below 1.1750 following a recovery attempt earlier in the day. The US Dollar gathers strength and weighs on the pair as investors seek refuge in the wake of Israel and the United States' joint attack on Iran.

GBP/USD targets 1.3500 barrier near moving averages

GBP/USD rebounds from the daily losses, trading around 1.3450 during the Asian hours on Monday. The technical analysis of the daily chart indicates an ongoing bearish bias, as the pair trades within a descending channel pattern.

Gold surges on safe-haven demand, rises above $5,400

Gold benefits from intense risk-aversion on Monday and climbs above $5,400, setting a fresh monthly-high in the process. Tensions in the Middle East remain high as Israel and Hezbollah continue to exchange strikes following the US-Israel joint attack on Iran over the weekend.

Bitcoin, Ethereum and Ripple under pressure as key supports face breakdown risk

Bitcoin, Ethereum, and Ripple prices trade on the back foot at the start of this week on Monday, after extending losses in the previous week. BTC is on the brink of a breakdown, ETH is capped below key resistance, and XRP risks a crack of the trendline.

The market is paying for insurance, not apocalypse

As expected, this morning felt less like a Monday market open and more like a fire drill. Futures screens flickered red. S&P contracts down almost 1%. Nasdaq off 1.2%. Brent leaped 13% through $80. Gold rose 1.6% toward $5350 before paring some gains. The dollar is strutting mildly. The Swiss franc is quietly doing what it always does in a storm, catching some safe-haven flows.

Pi Network Price Forecast: Core team offloads supply, weighing on PI recovery

Pi Network  hovers below $0.1700, broadly steady at press time on Monday, attempting a recovery after a 2% loss the previous day. Sunday’s decline aligned with nearly 49 million PI tokens offloaded by the Pi Foundation, implying a spike in supply pressure that capped the prevailing four-day recovery.