|
EUR/JPY Price Analysis: Euro vulnerable vs. yen, challenges the 122.00 figure
- EUR/JPY wedge pattern is weakening the market.
- The level to beat for bears is the 121.83 support.

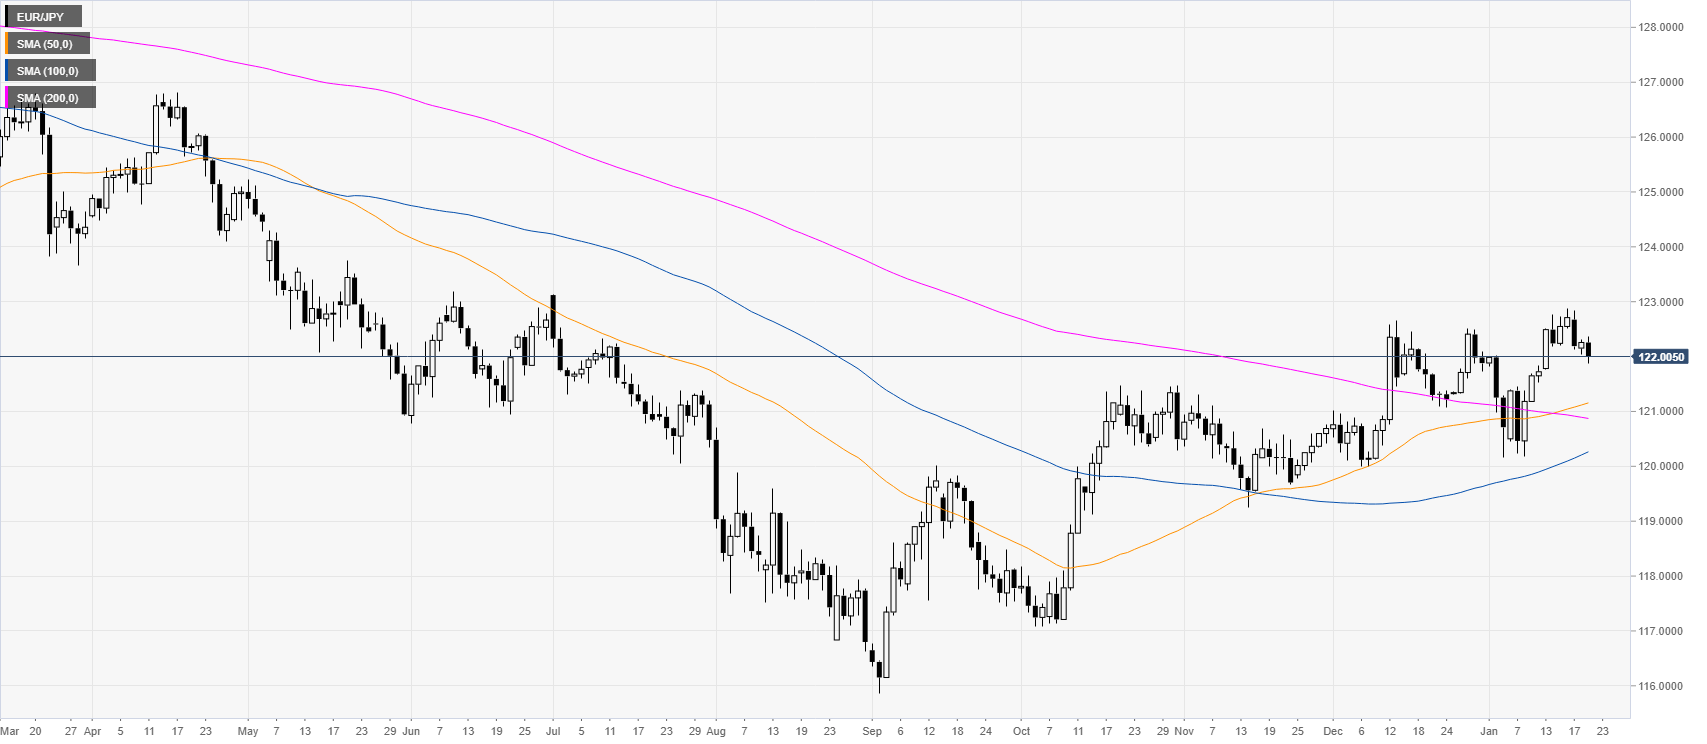
EUR/JPY daily chart
Following Friday’s bearish bar, the spot is exhibiting weakness below the 122.00 level while trading above the main daily simple moving averages (SMAs).
EUR/JPY four-hour chart
The market broke from a rising wedge pattern while challenging the 121.83 support and nearing the 100-period simple moving average (SMA) on the four-hour chart. As the market is weakening the spot is set to trade sideways to down, with a potential bearish breakdown below the 121.83 level which can lead to 121.64 and 121.13 levels, according to the Technical Confluences Indicator. Resistances are seen near 122.21, 122.66 and 122.90.
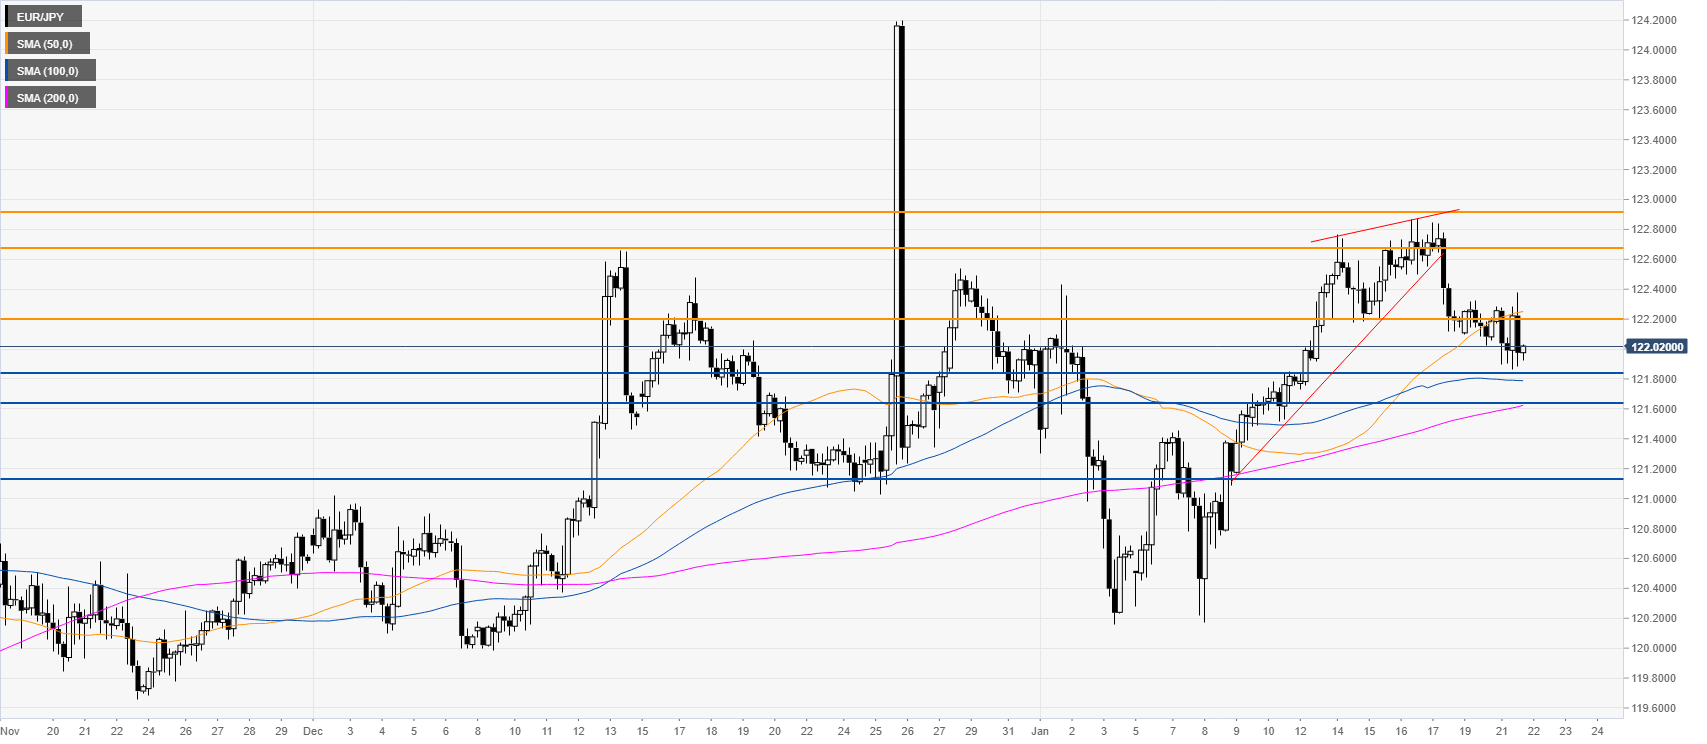
Resistance 122.21, 122.66, 122.90
Support 121.83, 121.64, 121.13
Additional key level
Author

Flavio Tosti
Independent Analyst
More from Flavio Tosti


