|

EUR/JPY Price Analysis: Euro drop to its lowest since October 2019 vs. yen

  • EUR/JPY is under heavy pressure near four-month lows. 
  • The level to beat for bears is the 118.73 support.
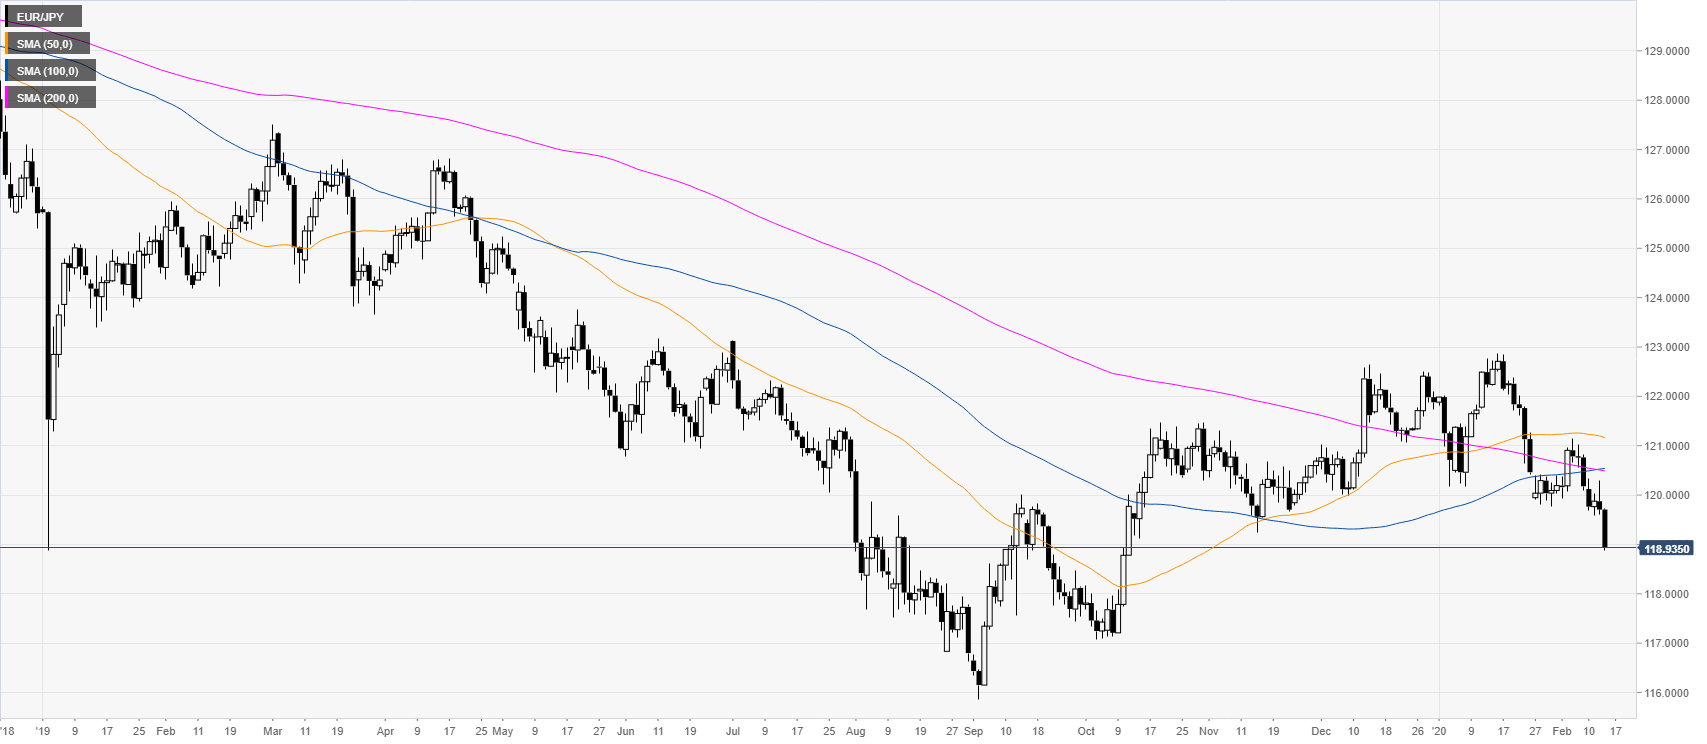
 

EUR/JPY daily chart

 
EUR/JPY is trading close to four-months lows while trading under its main daily simple moving averages (SMAs).
 

EUR/JPY four-hour chart

 
The spot is trading below its main SMAs suggesting a bearish bias in the medium term. As the market is dropping to four-month lows, the bears are looking for a continuation down towards the 118.73 level. A break below the above-mentioned support could lead to extra losses towards the 118.49 and 117.87 levels. Resistance is seen near the 119.23, 119.48 and 119.73 price levels, according to the Technical Confluences Indicator.    
 
  
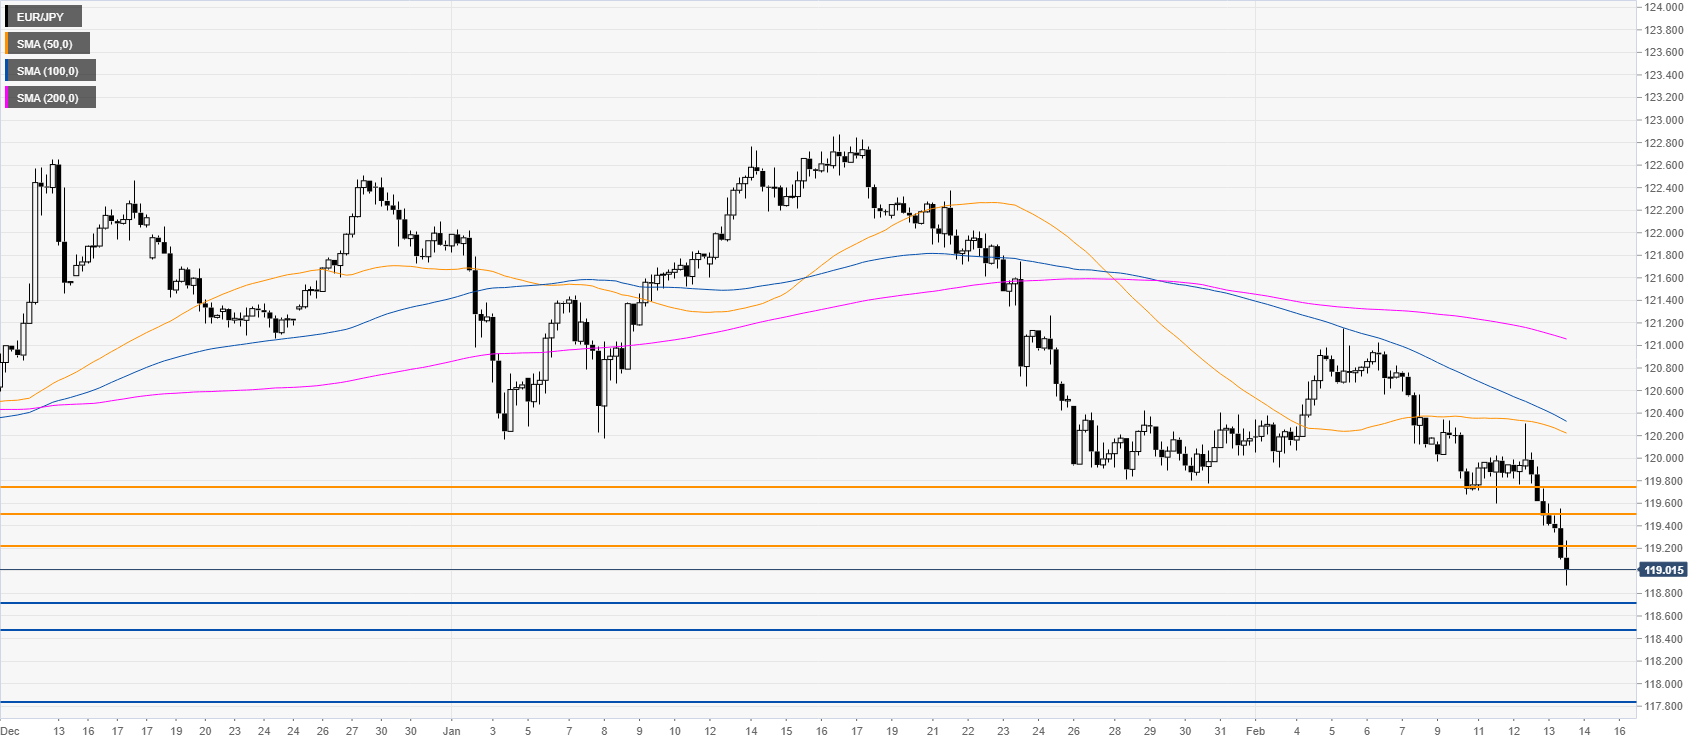
Resistance: 119.23, 119.48, 119.73
Support: 118.73, 118.49, 117.87 
 

Additional key levels

EUR/JPY

Overview
Today last price118.94
Today Daily Change-0.77
Today Daily Change %-0.64
Today daily open119.71
 
Trends
Daily SMA20120.75
Daily SMA50121.2
Daily SMA100120.52
Daily SMA200120.5
 
Levels
Previous Daily High120.3
Previous Daily Low119.62
Previous Weekly High121.15
Previous Weekly Low119.92
Previous Monthly High122.88
Previous Monthly Low119.78
Daily Fibonacci 38.2%119.88
Daily Fibonacci 61.8%120.04
Daily Pivot Point S1119.45
Daily Pivot Point S2119.19
Daily Pivot Point S3118.76
Daily Pivot Point R1120.14
Daily Pivot Point R2120.57
Daily Pivot Point R3120.83

Author

Flavio Tosti

Flavio Tosti

Independent Analyst


More from Flavio Tosti
Share:

Editor's Picks

EUR/USD flirts with weekly lows near 1.1770

EUR/USD now comes under further selling pressure, breaking below the 1.1800 support to challenge the area of weekly throughs near 1.1770 on Thursday. The pair’s decline comes in response to marked gains in the US Dollar amid steady geopolitical tensions. Ealier in the day, the ECB’s Lagarde delivered cautious remarks, although the currency remained apathetic.

GBP/USD threatens the 200-day SMA near 1.3440

GBP/USD rapidly leaves behind Wednesday’s strong advance, coming under heavy pressure and retesting the 1.3440 zone, where the critical 200-day SMA is located. Cable’s deep pullback follows the strong gains in the Greenback, while investors continue to pencil in a potential BoE rate cut in March.

Gold trims gains, slips back to around $5,170

Gold is now facing some downside pressure, hovering around the $5,170 region on Thursday. The yellow metal surrenders part of its earlier gains on the back of the resurgence of the buying interest in the Greenback. In the meantime, geopolitical tensions in the Middle East continue to limit the downside potential for now.

Stellar: Relief bounce fades as bearish undertone persists

Stellar is trading around $0.16 at the time of writing on Thursday after rebounding more than 8% in the previous day. Derivatives data paints a negative picture as XLM’s short bets hit a monthly high while Open Interest continues to decline.

Changing the game: International implications of recent tariff developments

The Supreme Court ruling on International Emergency Economic Powers Act (IEEPA) tariffs provides limited relief for the rest of the world, with weighted average tariff rates modestly lower.

Bitcoin steadies as traders eye US–Iran talks

Bitcoin (BTC) price is stabilizing around $68,000 at the time of writing on Thursday after a 6.2% relief rally the previous day amid a broader downward trend.