EUR/JPY Price Analysis: Consolidates around 164.00 as intervention threats remain


  • EUR/JPY slightly falls to 164.65, amid intervention rumors, ECB easing expectations.
  • Surpassing 165.00 may indicate bullish trend, aiming beyond YTD high to 166.00.
  • Falling below 164.00 might lead to correction, with key supports at Ichimoku Cloud indicators.

The EUR/JPY pair remains subdued in early trading during the North American session, posting minuscule losses of 0.14% and exchanging hands at 164.65. Japanese authorities intervention threats, along with speculations that the European Central Bank (ECB) could begin easing policy in June, increased appetite for the safe-haven Japanese Yen (JPY).

EUR/JPY Price Analysis: Technical outlook

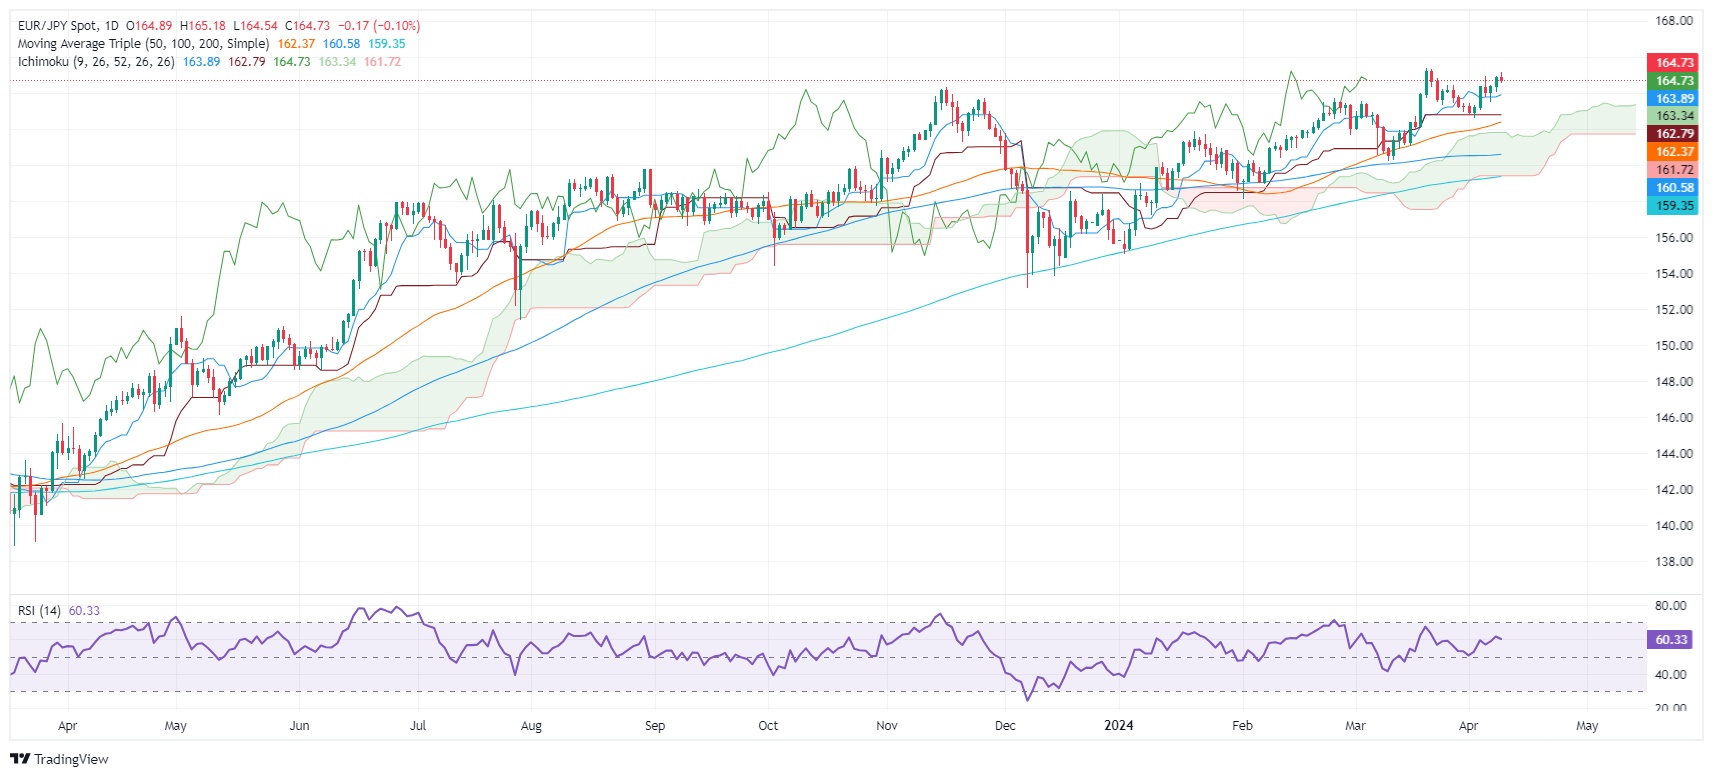
From a technical standpoint, the EUR/JPY is in consolidation at around the 164.00/165.33 year-to-date (YTD) high, with price action getting closer to the Ichimoku Cloud (Kumo). That means the uptrend stalled, and market participants are scrambling for direction in the pair.

For a bullish continuation, the EUR/JPY must break above 165.00, followed by the YTD high of 165.33. Up next sits the psychological 166.00 figure.

Conversely, if sellers push prices below 164.00, that would pave the way for a deeper correction. The next support would be the Tenkan Sen at 163.89, followed by the Senkou Span A at 163.33. Further losses are seen at the Kijun-Sen at 162.78, before clashing with the top of the Kumo around 162.50.

EUR/JPY Price Action – Daily Chart

EUR/JPY

Overview
Today last price 164.69
Today Daily Change -0.20
Today Daily Change % -0.12
Today daily open 164.89
 
Trends
Daily SMA20 163.43
Daily SMA50 162.28
Daily SMA100 160.56
Daily SMA200 159.31
 
Levels
Previous Daily High 164.91
Previous Daily Low 164.04
Previous Weekly High 164.92
Previous Weekly Low 162.61
Previous Monthly High 165.36
Previous Monthly Low 160.22
Daily Fibonacci 38.2% 164.57
Daily Fibonacci 61.8% 164.37
Daily Pivot Point S1 164.32
Daily Pivot Point S2 163.74
Daily Pivot Point S3 163.44
Daily Pivot Point R1 165.19
Daily Pivot Point R2 165.48
Daily Pivot Point R3 166.06


Share: Feed news

Information on these pages contains forward-looking statements that involve risks and uncertainties. Markets and instruments profiled on this page are for informational purposes only and should not in any way come across as a recommendation to buy or sell in these assets. You should do your own thorough research before making any investment decisions. FXStreet does not in any way guarantee that this information is free from mistakes, errors, or material misstatements. It also does not guarantee that this information is of a timely nature. Investing in Open Markets involves a great deal of risk, including the loss of all or a portion of your investment, as well as emotional distress. All risks, losses and costs associated with investing, including total loss of principal, are your responsibility. The views and opinions expressed in this article are those of the authors and do not necessarily reflect the official policy or position of FXStreet nor its advertisers. The author will not be held responsible for information that is found at the end of links posted on this page.

If not otherwise explicitly mentioned in the body of the article, at the time of writing, the author has no position in any stock mentioned in this article and no business relationship with any company mentioned. The author has not received compensation for writing this article, other than from FXStreet.

FXStreet and the author do not provide personalized recommendations. The author makes no representations as to the accuracy, completeness, or suitability of this information. FXStreet and the author will not be liable for any errors, omissions or any losses, injuries or damages arising from this information and its display or use. Errors and omissions excepted.

The author and FXStreet are not registered investment advisors and nothing in this article is intended to be investment advice.

Recommended content


Recommended content

Editors’ Picks

AUD/USD retargets the 0.6600 barrier and above

AUD/USD retargets the 0.6600 barrier and above

AUD/USD extended its positive streak for the sixth session in a row at the beginning of the week, managing to retest the transitory 100-day SMA near 0.6580 on the back of the solid performance of the commodity complex.

AUD/USD News

EUR/USD keeps the bullish bias above 1.0700

EUR/USD keeps the bullish bias above 1.0700

EUR/USD rapidly set aside Friday’s decline and regained strong upside traction in response to the marked retracement in the Greenback following the still-unconfirmed FX intervention by the Japanese MoF.

EUR/USD News

Gold advances for a third consecutive day

Gold advances for a third consecutive day

Gold fluctuates in a relatively tight channel above $2,330 on Monday. The benchmark 10-year US Treasury bond yield corrects lower and helps XAU/USD limit its losses ahead of this week's key Fed policy meeting.

Gold News

Bitcoin price dips to $62K range despite growing international BTC validation via spot ETFs

Bitcoin price dips to $62K range despite growing international BTC validation via spot ETFs

Bitcoin (BTC) price closed down for four weeks in a row, based on the weekly chart, and could be on track for another red candle this week. The last time it did this was in the middle of the bear market when it fell by 42% within a span of nine weeks. 

Read more

Japan intervention: Will it work?

Japan intervention: Will it work?

Dear Japan Intervenes in the Yen for the first time since November 2022 Will it work? Have we seen a top in USDJPY? Let's go through the charts.

Read more

Forex MAJORS

Cryptocurrencies

Signatures