|

EUR/JPY Price Analysis: Bulls struggle to justify dovish BoJ talks below 157.70 key resistance

  • EUR/JPY prods three-day uptrend, making rounds to one-week high.
  • BoJ Minutes, Deputy Governor Uchida defend Japan central bank’s easy-money policy.
  • Five-week-old descending resistance line appears the key challenge for bulls.
  • Looming bull cross on MACD, upbeat RSI and BoJ clues favor cross-currency pair’s buyers.

EUR/JPY remains sidelined near 157.30-40 as bulls struggle to defend a three-day uptrend at the highest levels since July 24 amid early Wednesday. In doing so, the cross-currency pair falls short of justifying the Bank of Japan’s (BoJ) dovish rhetoric, via June month’s monetary policy meeting minutes, as well as the dovish comments from BoJ Deputy Governor Shinichi Uchida.

It’s worth noting that the sour sentiment, driven by the US credit rating cut, exerts downside pressure on the EUR/JPY as markets await the top-tier data/events.

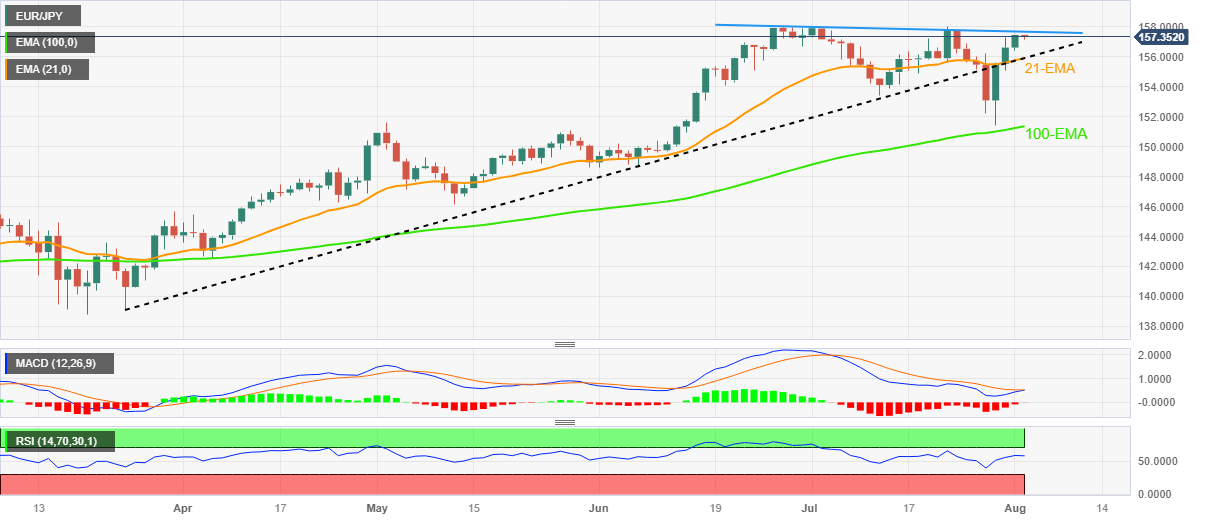
Technically, sustained rebound from the 100-day Exponential Moving Average (EMA), around 151.35 by the press time, joins the looming bull cross on the MACD and the upbeat RSI (14) line to favor the EUR/JPY buyers.

Following that, a convergence of the 21-EMA and an upward-sloping support line from late March, close to 155.90 at the latest, will challenge the EUR/JPY bulls.

It’s worth noting, however, that the pair buyers remain off the table unless witnessing a daily closing beyond the five-week-old descending resistance line, near 157.70 at the latest.

On the contrary, a daily closing below 155.90 can trigger the short-term downside of the EUR/JPY pair ahead of the 100-EMA level of 151.35.

Following that, the 150.00 round figure will act as the final defense of the EUR/JPY bulls.

EUR/JPY: Daily chart

Trend: Further upside expected

Additional important levels

Overview
Today last price157.37
Today Daily Change-0.09
Today Daily Change %-0.06%
Today daily open157.46
 
Trends
Daily SMA20155.84
Daily SMA50154.15
Daily SMA100150.12
Daily SMA200146.57
 
Levels
Previous Daily High157.49
Previous Daily Low156.39
Previous Weekly High157.8
Previous Weekly Low151.41
Previous Monthly High158.05
Previous Monthly Low151.41
Daily Fibonacci 38.2%157.07
Daily Fibonacci 61.8%156.81
Daily Pivot Point S1156.74
Daily Pivot Point S2156.02
Daily Pivot Point S3155.64
Daily Pivot Point R1157.83
Daily Pivot Point R2158.21
Daily Pivot Point R3158.93

Author

Anil Panchal

Anil Panchal

FXStreet

Anil Panchal has nearly 15 years of experience in tracking financial markets. With a keen interest in macroeconomics, Anil aptly tracks global news/updates and stays well-informed about the global financial moves and their implications.

More from Anil Panchal
Share:

Editor's Picks

GBP/USD appears well offered near 1.3160

GBP/USD builds on Tuesday’s losses, although it now manages to pick up some pace and bounce off earlier multi-month troughs near 1.3140. The Greenback’s solid performance and continued political turmoil in the UK are keeping Cable under persistent pressure, with little sign of a meaningful recovery.

EUR/USD rebounds from lows, back to 1.1360

After bottoming out near 1.1320, EUR/USD gathers some traction and reclaims the 1.1350-1.1360 band as the NA session draws to a close on Wednesday. The pair’s drop to multi-month lows comes in response to the continuous leg higher in the US Dollar, which remains propped up by hawkish Fed expectations and uncertainty over the outcome of US-Iran peace negotiations.

Gold pressured near fresh 2026 lows

Gold accelerates its decline and gyrates around the key $4,000 mark per troy ounce on Wednesday, its lowest level since November 2025. In the meantime, tighter-for-longer Fed expectations and a broadly firmer US Dollar continue to weigh on the yellow metal, while uncertainty surrounding a potential US-Iran peace agreement has done little to revive demand for the safe haven space.

XRP nears key support as Fed hike risks suppress demand
Ripple (XRP) continues to face significant selling pressure, trading around $1.05 at the time of writing on Wednesday. This decline mirrors the broader weakness in the crypto market, exacerbated by mounting macroeconomic headwinds and persistent geopolitical uncertainties.
US-Iran talks: The next 60 days will decide where Oil prices go next
Oil markets received some encouraging news after weeks of rising tensions in the Middle East. But let’s not get ahead of ourselves: we’re far from victory, and markets just seem to have priced out the worst-case scenario. The US and Iran have reportedly made "substantive progress" in talks in Switzerland and agreed on a framework for working toward a broader deal within 60 days.
Regime change: Inside Kevin Warsh's first move to make the Fed unreadable on purpose

The rate did not move. That was the least interesting thing about Kevin Warsh's first meeting in charge of the Fed. The FOMC held its benchmark at 3.50%-3.75% for the fourth straight meeting, exactly as priced, and then the new chair used his first press conference to dismantle the machinery the market has leaned on for a decade.