|

EUR/JPY Price Analysis: Bulls maintain dominant position, near-term might be pressure coming

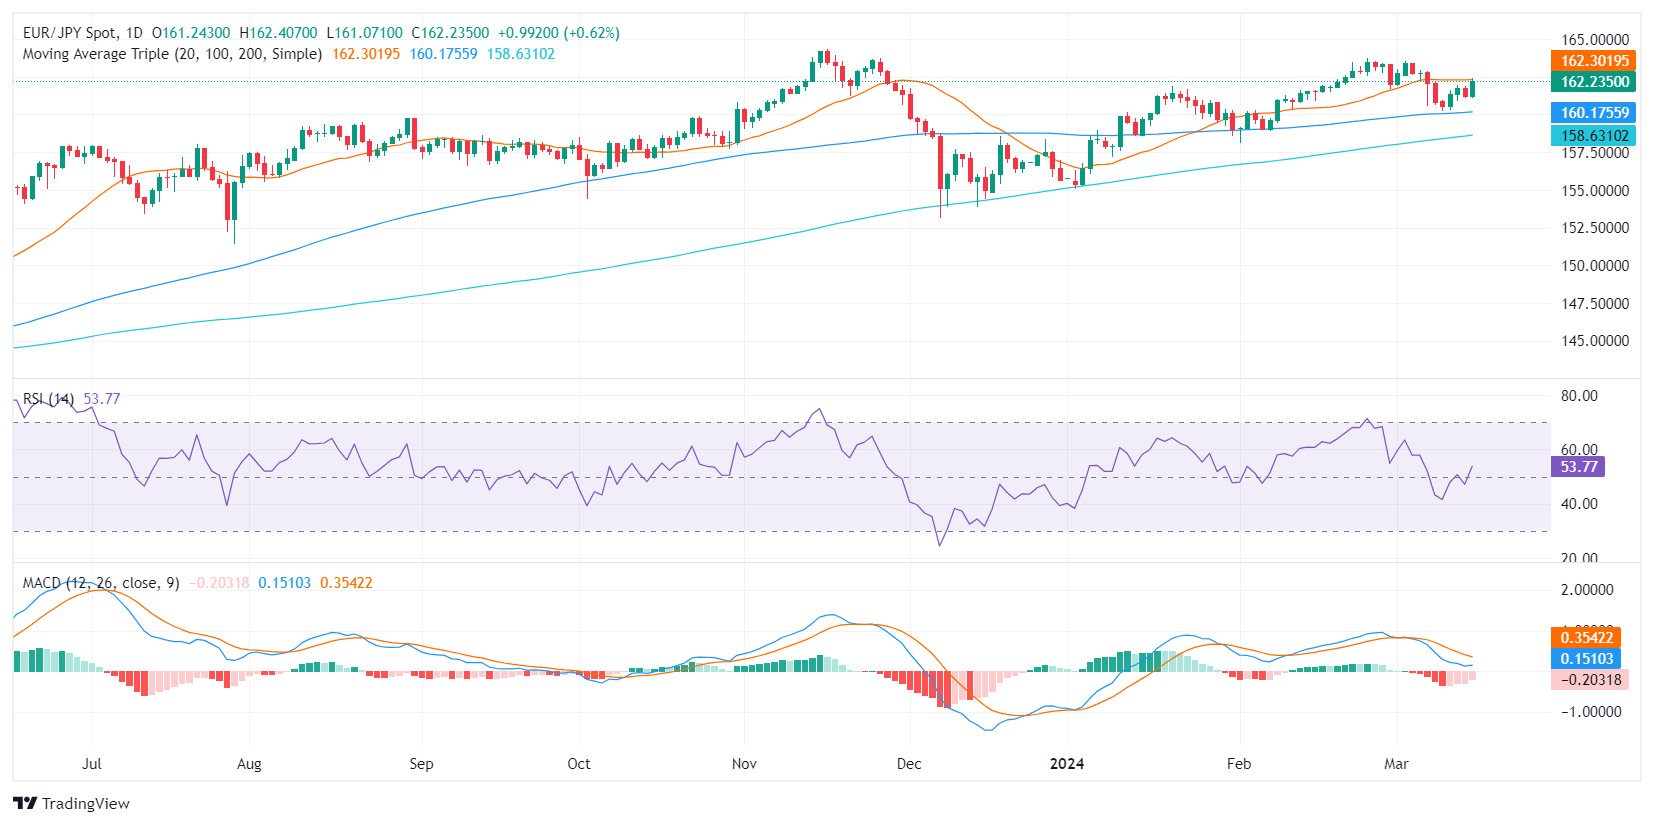
  • The pair met strong resistance at the 20-day SMA, which in case of conquering it, will confirm a bullish bias.
  • The daily chart indicators suggest a strengthening upward momentum with the RSI jumping above 50.
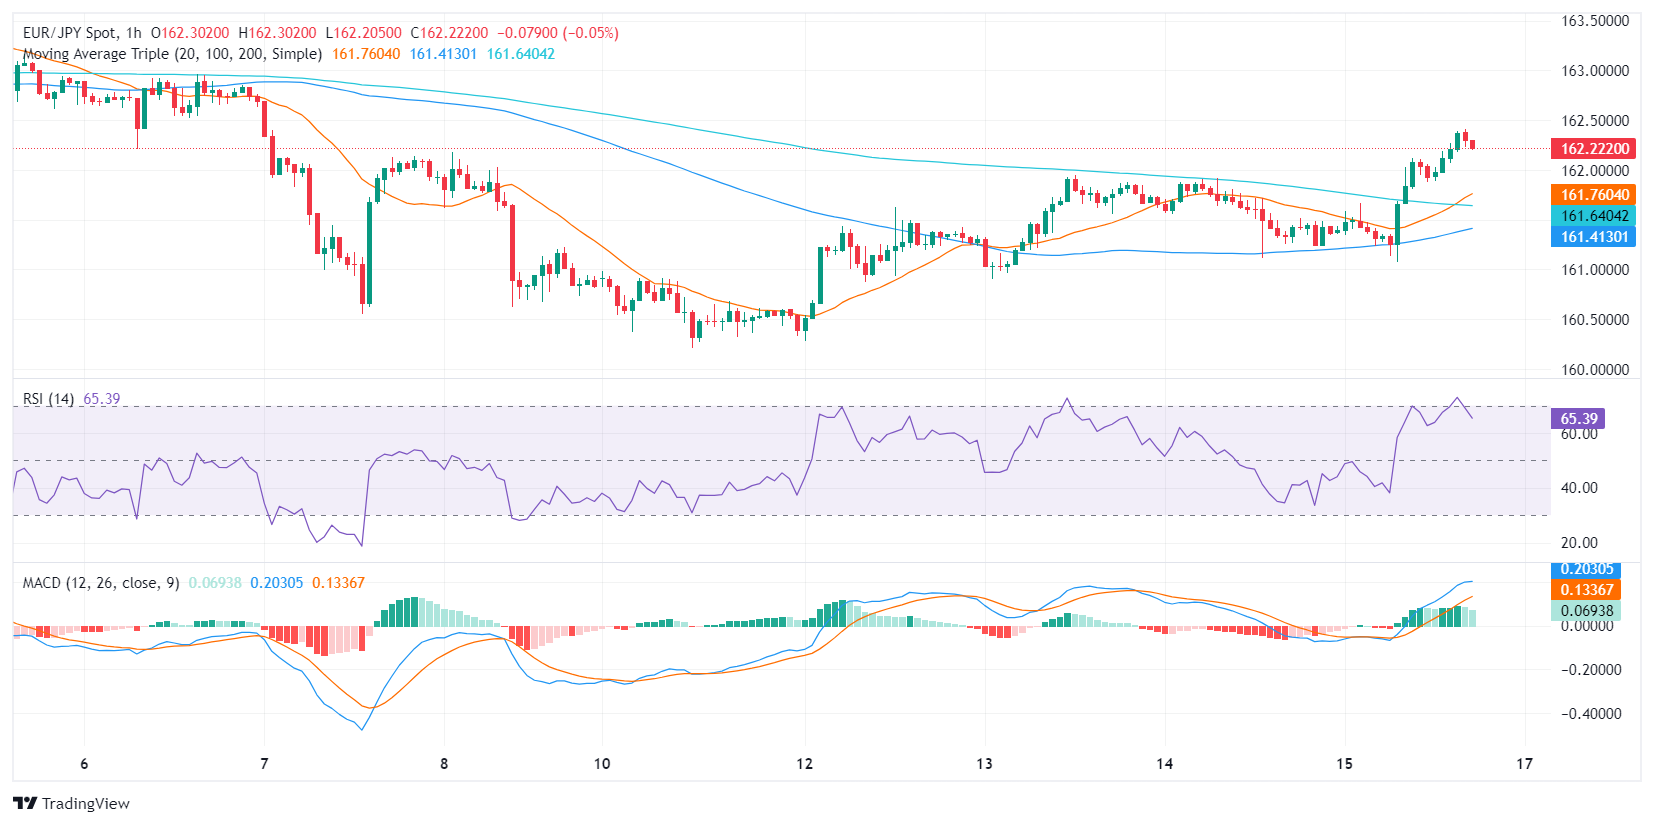
  • The hourly RSI hovers in the overbought territory, a potential sign of short-term buyer exhaustion.

In Friday's session, EUR/JPY trades with gains at 162.27, marking a 0.54% rise in attempting to conquer the 20-day Simple Moving Average (SMA). The bulls seemingly hold a strong grip, as the buying momentum appears to intensify. Yet, the sellers might come into action as the indicators flash overbought signs on the hourly signs.

Based on the indicators of the daily chart for the EUR/JPY pair, the Relative Strength Index (RSI) has moved into positive territory, suggesting a stronger upward momentum. Meanwhile, the downturn of the Moving Average Convergence Divergence (MACD) histogram prints shortening red bars, arguing in favor of a stronger bullish grip.

EUR/JPY daily chart

Turning to the hourly chart, the RSI seems to be hovering in the overbought territory. Despite a strong upward trend, this indicates potential exhaustion from the buyers. Similarly, the MACD's decreasing green bars might be signaling a shift in the tide, turning favor towards sellers for the short-term period.

EUR/JPY hourly chart

Given that the pair remains above the 100- and 200-day SMAs, yet below the 20-day SMA, it gives mixed signals regarding the broader market control. Thus, an interplay of daily and hourly charts suggests an uphill battle with the bulls maintaining control in a larger context, albeit facing potential near-term pressures.

EUR/JPY

Overview
Today last price162.24
Today Daily Change1.00
Today Daily Change %0.62
Today daily open161.24
 
Trends
Daily SMA20162.29
Daily SMA50160.98
Daily SMA100160.13
Daily SMA200158.57
 
Levels
Previous Daily High161.92
Previous Daily Low161.11
Previous Weekly High163.52
Previous Weekly Low160.56
Previous Monthly High163.72
Previous Monthly Low158.08
Daily Fibonacci 38.2%161.42
Daily Fibonacci 61.8%161.61
Daily Pivot Point S1160.93
Daily Pivot Point S2160.62
Daily Pivot Point S3160.13
Daily Pivot Point R1161.74
Daily Pivot Point R2162.23
Daily Pivot Point R3162.54

Author

Patricio Martín

Patricio is an economist from Argentina passionate about global finance and understanding the daily movements of the markets.

More from Patricio Martín
Share:

Markets move fast. We move first.

Orange Juice Newsletter brings you expert driven insights - not headlines. Every day on your inbox.

By subscribing you agree to our Terms and conditions.

Editor's Picks

EUR/USD holds steady near 1.1750 on first trading day of 2026

EUR/USD stays calm on Friday and trades in a narrow channel at around 1.1750 as trading conditions remain thin following the New Year holiday and ahead of the weekend. The economic calendar will not feature any high-impact data releases.

GBP/USD struggles to gain traction, stabilizes above 1.3450

After testing 1.3400 on the last day of 2025, GBP/USD managed to stage a rebound. Nevertheless, the pair finds it difficult to gather momentum and moves sideways above 1.3450 as market participants remain in holiday mood.

Gold climbs toward $4,400 following deep correction

Gold reverses its direction and advances toward $4,400 after suffering heavy losses amid profit-taking before the New Year holiday. Growing expectations for a dovish Fed policy and persistent geopolitical risks seem to be helping XAU/USD stretch higher.

Cardano gains early New Year momentum, bulls target falling wedge breakout

Cardano kicks off the New Year on a positive note and is extending gains, trading above $0.36 at the time of writing on Friday. Improving on-chain and derivatives data point to growing bullish interest, while the technical outlook keeps an upside breakout in focus.

Economic outlook 2026-2027 in advanced countries: Solidity test

After a year marked by global economic resilience and ending on a note of optimism, 2026 looks promising and could be a year of solid economic performance. In our baseline scenario, we expect most of the supportive factors at work in 2025 to continue to play a role in 2026.

Crypto market outlook for 2026

Year 2025 was volatile, as crypto often is.  Among positive catalysts were favourable regulatory changes in the U.S., rise of Digital Asset Treasuries (DAT), adoption of AI and tokenization of Real-World-Assets (RWA).