|

EUR/JPY Price Analysis: Bullish push persists, eyes on waning momentum

  • Flattening indicators on the daily chart may signal a period of consolidation.
  • The flat RSI slope and falling MACD bars on the hourly chart translate into a neutral sentiment for the session.

The EUR/JPY currency pair stands at 164.71, reflecting a persistent bullish upsurge as it cleared daily losses and defended the 20-day Simple Moving Averages (SMA). However, caution is warranted considering the shifting market environment as the flattening momentum, revealed on the daily and hourly chart may cool down the bullish outlook.

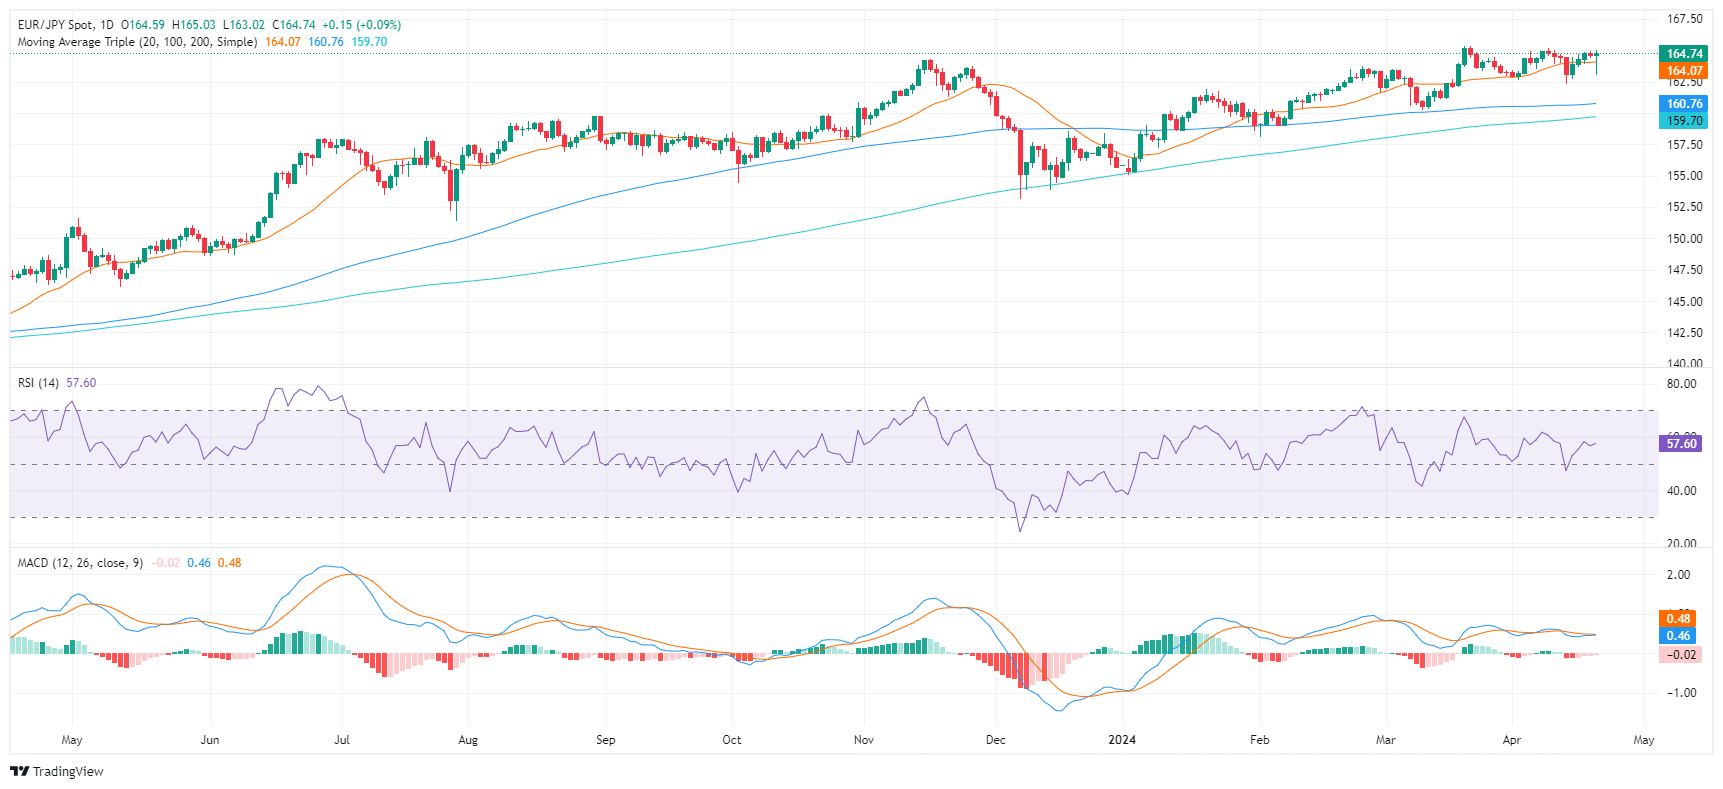
On the daily chart, the Relative Strength Index (RSI) pair is trending positive, at 58 but flattened. Simultaneously, the Moving Average Convergence Divergence (MACD) reveals red bars, hinting at a steady selling pressure.

EUR/JPY daily chart

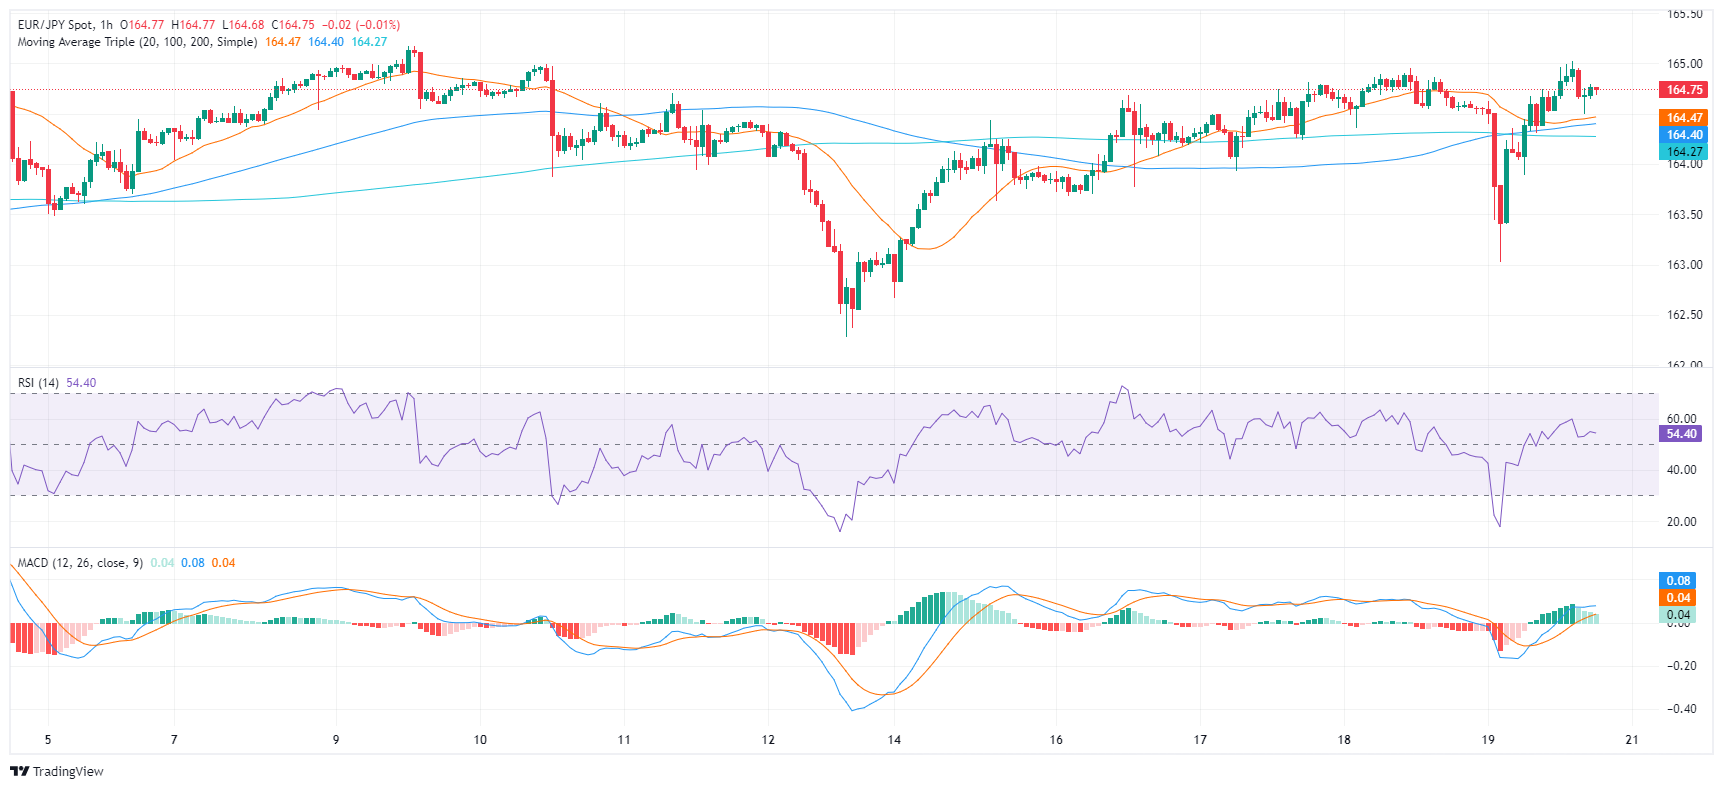
Taking into account the hourly chart, the latest RSI value is just above the middle ground at 53, also with a flat slope. This signifies neutrality within the market. Meanwhile, the MACD decreasing green bars, signaling a potential slowdown in the upward pressure.

EUR/JPY hourly chart

In light of the recent market conditions, the EUR/JPY lies above its 20,100, and 200-day SMA, depicting a sturdy ascending pattern in its broader outlook. It suggests the pair have shown resilience in maintaining the bullish momentum both from a short-term and long-term perspective. On Friday, the cross held onto the 20-day SMA at 164.00, suggesting that the bulls remain resilient. Essentially, if the pair continues to stay above the SMA's, it could extend its upward trajectory, enhancing its technical stance in the forthcoming sessions.

EUR/JPY

Overview
Today last price164.64
Today Daily Change0.05
Today Daily Change %0.03
Today daily open164.59
 
Trends
Daily SMA20164.02
Daily SMA50163.02
Daily SMA100160.71
Daily SMA200159.65
 
Levels
Previous Daily High164.96
Previous Daily Low164.35
Previous Weekly High165.18
Previous Weekly Low162.28
Previous Monthly High165.36
Previous Monthly Low160.22
Daily Fibonacci 38.2%164.58
Daily Fibonacci 61.8%164.73
Daily Pivot Point S1164.31
Daily Pivot Point S2164.03
Daily Pivot Point S3163.71
Daily Pivot Point R1164.91
Daily Pivot Point R2165.23
Daily Pivot Point R3165.51

Author

Patricio Martín

Patricio is an economist from Argentina passionate about global finance and understanding the daily movements of the markets.

More from Patricio Martín
Share:

Markets move fast. We move first.

Orange Juice Newsletter brings you expert driven insights - not headlines. Every day on your inbox.

By subscribing you agree to our Terms and conditions.

Editor's Picks

EUR/USD comes under pressure near 1.1600

EUR/USD is now facing increasing selling pressure, abandoning the area of recent daily highs and refocusing on the 1.1600 region amid decent losses for the day. The pair’s correction comes in response to the acceptable bounce in the US Dollar, while traders gear up for upcoming key data releases in the US.

GBP/USD recedes to 1.3140 on USD rebound

GBP/USD remains on the back foot on Friday, retreating to the 1.3140 region on the back of the marked upside impulse in the Greenback. In the meantime, worries about the UK’s fiscal discipline and political stability keep the British Pound under scrutiny, weighing on Cable. Adding to the noise, reports suggested PM Starmer and Chancellor Reeves have shelved plans to raise income tax rates.

Gold meets some contention just above $4,000

Gold trade with heavy losses, approaching the key $4,000 mark per troy ounce on the back of the marked bounce in the US Dollar, higher US Treasury yields across the curve and fading expectations for a Fed rate cut in December.

Crypto Today: Bitcoin, Ethereum, XRP sell-off persists amid low institutional and retail demand

Bitcoin is trading above $97,000 at the time of writing on Friday amid a sticky bearish wave in the broader cryptocurrency market. The sell-off extends to altcoins, with Ethereum and Ripple hovering below $3,200 and $2.30, respectively.

Weekly focus: Looking towards post-shutdown US data

The end of US government shutdown was not enough to drive a lasting recovery in markets' risk appetite, with equity and bond markets weakening towards the end of the week.

VeChain mainnet upgrade shifts consensus mechanism from PoA to DPoS as VET extends decline 

VeChain holds above $0.0150 as overhead pressure signals a 15% downside risk. VeChain migrates from Proof of Authority to Delegated Proof of Stake to power the network’s next growth phase.