|

EUR/JPY Price Analysis: Bearish sentiment gains sway, 20-day SMA lost

  • Increasing bearish pressure is shown by the RSI and MACD of both hourly and daily charts.
  • Sellers appear to have control, after gaining the 20-day SMA.
  • Buyers need to maintain control over the 100 and 200-day SMAs to prevent further bearish inclination.

The EUR/JPY pair is settling at the 163.00 level, displaying a noteworthy shift favoring the sellers. Although the pair is securely situated above key long-term Simple Moving Averages (SMAs), implying a possible enduring bullish bias, recent indicators suggest a change in the narrative for the short term.

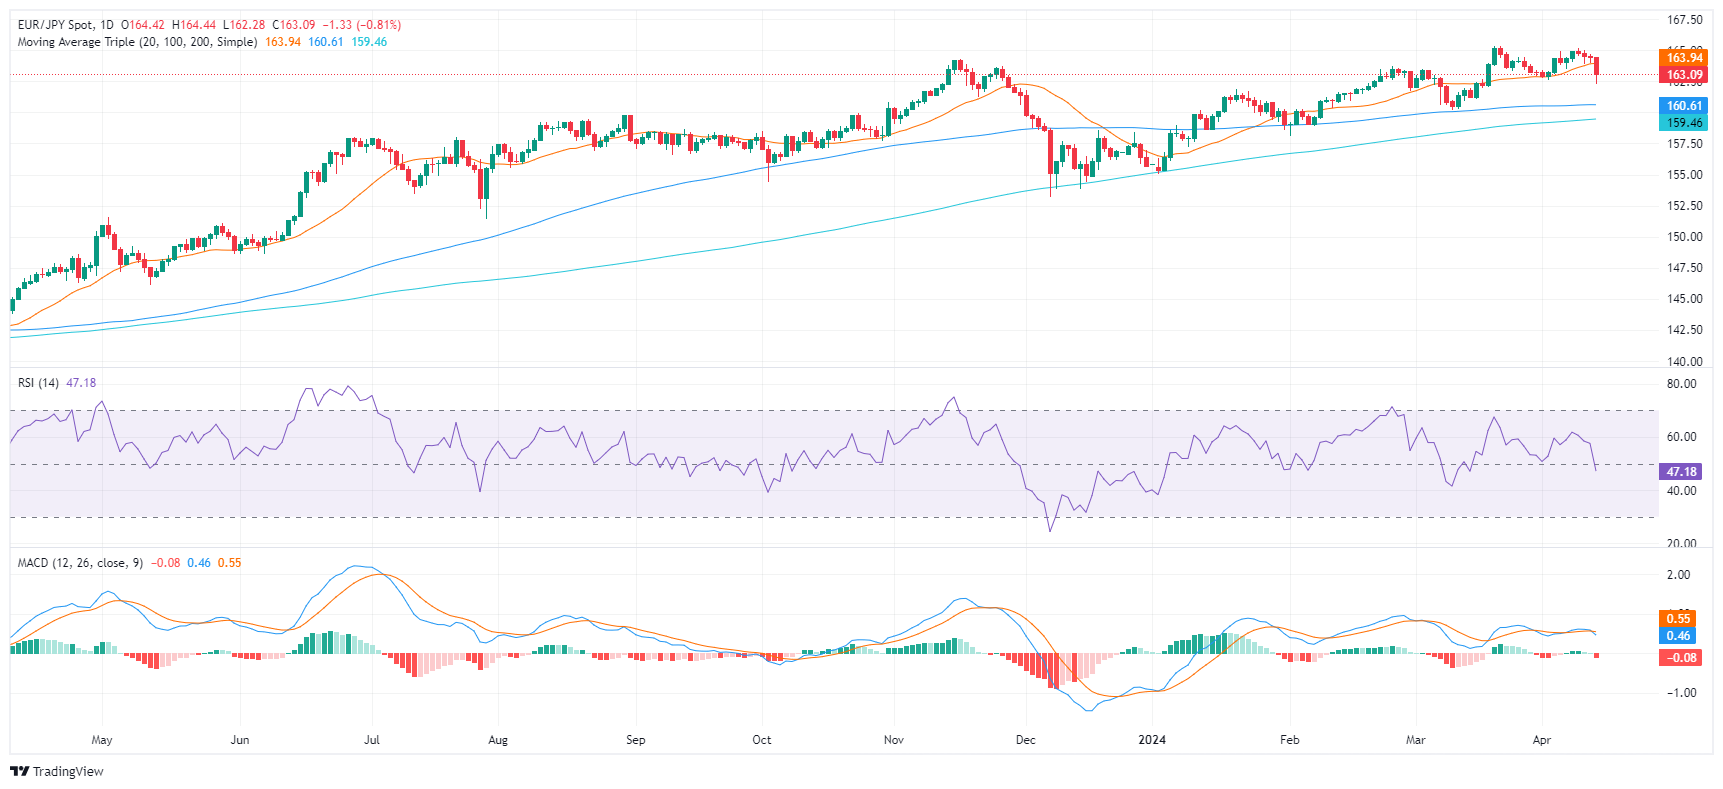
On the daily chart the Relative Strength Index (RSI) indicates a negative trend, having dropped from positive territory to 46. Illustrating this downward trajectory, the Moving Average Convergence Divergence (MACD) also prints red bars, indicating a negative momentum underway.

EUR/JPY daily chart

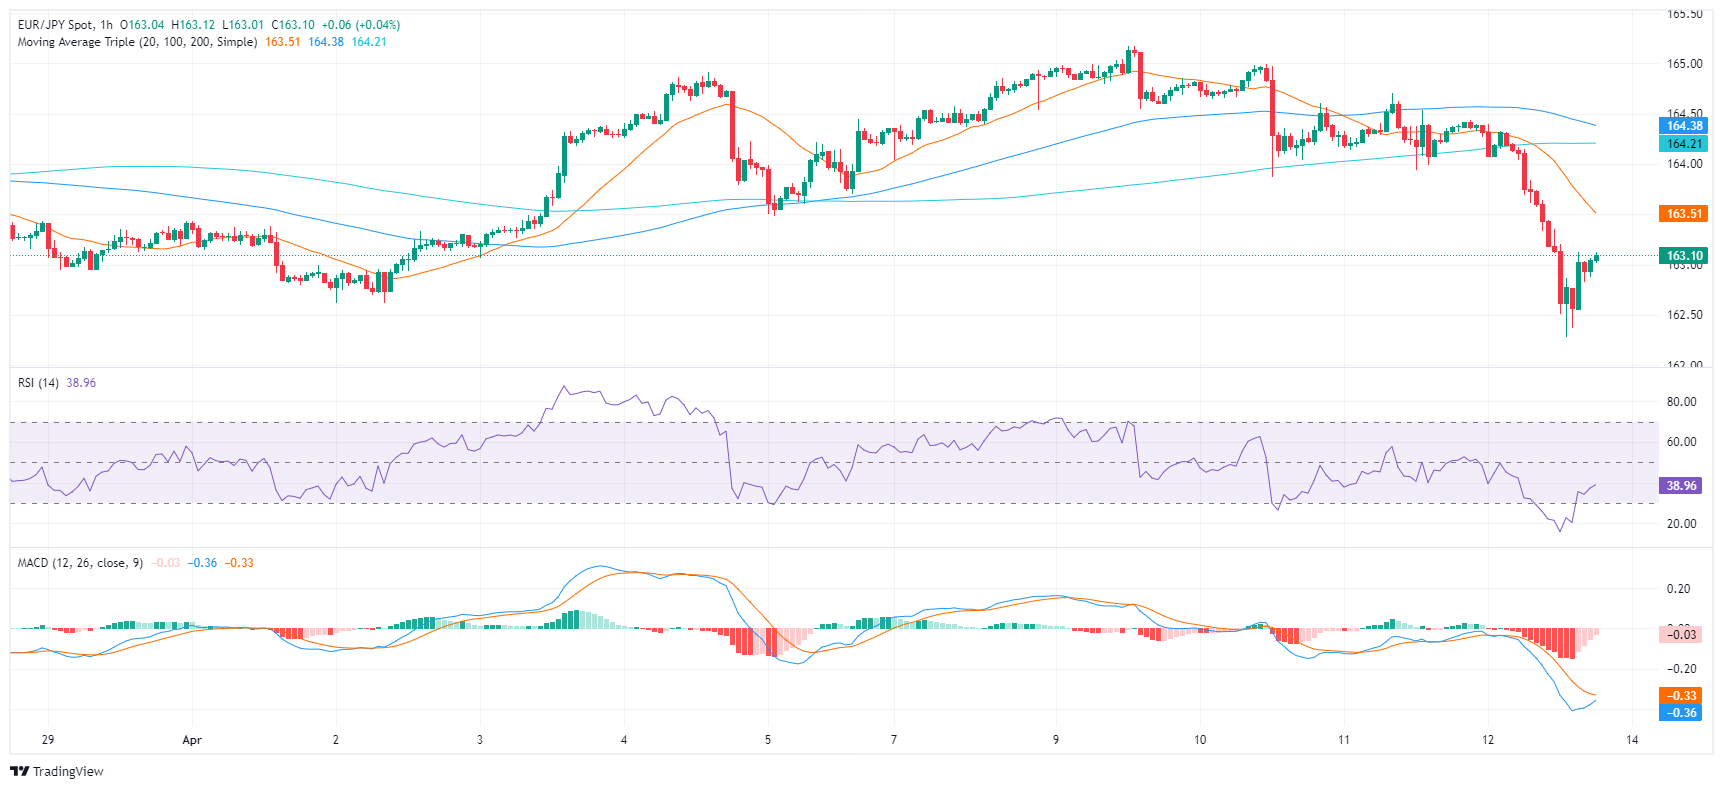
Switching to the hourly chart, the RSI reveals a similar picture, with the latest reading sitting at 39, reflecting a continuous negative trend. The MACD also prints red bars, carrying the negative momentum from the daily chart to the hourly chart. These indicators, together, could suggest an ongoing bearish pressure for the EUR/JPY throughout the session.

EUR/JPY hourly chart

On the broader outlook, the EUR/JPY gives mixed signals from a technical analysis standpoint. On Friday, it fell below the 20-day Simple Moving Average (SMA), hinting at a possible bearish shift in the short-term trend. This could trigger increased selling pressure on the pair with the potential of further losses. Yet, from a broader perspective, the cross stands above both the 100 and 200-day SMA, which leaves a long-term bullish outlook intact.

EUR/JPY

Overview
Today last price163.09
Today Daily Change-1.33
Today Daily Change %-0.81
Today daily open164.42
 
Trends
Daily SMA20163.9
Daily SMA50162.59
Daily SMA100160.61
Daily SMA200159.43
 
Levels
Previous Daily High164.7
Previous Daily Low163.94
Previous Weekly High164.92
Previous Weekly Low162.61
Previous Monthly High165.36
Previous Monthly Low160.22
Daily Fibonacci 38.2%164.23
Daily Fibonacci 61.8%164.41
Daily Pivot Point S1164
Daily Pivot Point S2163.59
Daily Pivot Point S3163.24
Daily Pivot Point R1164.76
Daily Pivot Point R2165.11
Daily Pivot Point R3165.52

Author

Patricio Martín

Patricio is an economist from Argentina passionate about global finance and understanding the daily movements of the markets.

More from Patricio Martín
Share:

Markets move fast. We move first.

Orange Juice Newsletter brings you expert driven insights - not headlines. Every day on your inbox.

By subscribing you agree to our Terms and conditions.

Editor's Picks

EUR/USD flat lines below mid-1.1600s; bulls await move beyond 50-day SMA amid weaker USD

The EUR/USD pair is seen oscillating in a narrow range during the Asian session on Friday and consolidating its recent strong gains to an over two-week high, touched the previous day. Spot prices currently trade around the 1.1635 area, nearly unchanged for the day and below the 50-day Simple Moving Average pivotal barrier.

GBP/USD slips near 1.3150 as UK government drops plans to raise tax rates

GBP/USD retraces its recent gains from the previous session, trading around 1.3150 during the Asian hours on Friday. The pair depreciates as the Pound Sterling declines amid rising concerns over fiscal discipline and political stability in the United Kingdom.

Gold buyers return with safe-haven flows, eyes weekly gain

Gold revisits the $4,200 level early Friday after a sharp pullback, eyes weekly gains. US Dollar consolidates weekly losses amid data disruption and reduced December Fed rate cut bets. Gold remains a ‘buy-on-pullbacks’ trade amid a four-hourly bullish technical setup.

Bitcoin, Ethereum and Ripple flash deeper downside risks as market selloff intensifies

Bitcoin, Ethereum and Ripple trade in red on Friday after correcting more than 5%, 10% and 2%, respectively, so far this week. BTC has slipped below the $100,000 key level, while ETH and XRP have faced rejection at their resistance levels, signaling that bears remain firmly in control and that a deeper correction may be underway.

How soon is the BoJ likely to resume interest rate hikes?

The Bank of Japan once again finds itself walking a tightrope between political pressure, economic data, and market expectations. With interest rates still anchored at 0.5%, speculation is growing over when Governor Ueda will pull the trigger on the next hike.

Ripple advances as whales step up accumulation amid renewed risk-on sentiment

Ripple (XRP) is trading slightly below $2.50 at the time of writing on Thursday, after marking an intraday high at $2.52 buoyed by positive sentiment in the broader cryptocurrency market.