|

EUR/JPY Price Analysis: Bearish momentum gains steam, long-term bullish signals warrant vigilance

  • Significant selling momentum is revealed in the daily chart as the RSI slips into negative zones while MACD signifies growing negative traction.
  • In line with the daily chart, the hourly indicators show mounting selling pressure.
  • The recent dip beneath the 20-day SMA may suggest a possible short-term bearish realignment.

The EUR/JPY pair is currently trading around 162.85, representing a decline of 0.30% during Monday's session. Bearish cues are intensifying as seen in the increase in selling momentum, which signals a possible shift from the preceding bullish trend.

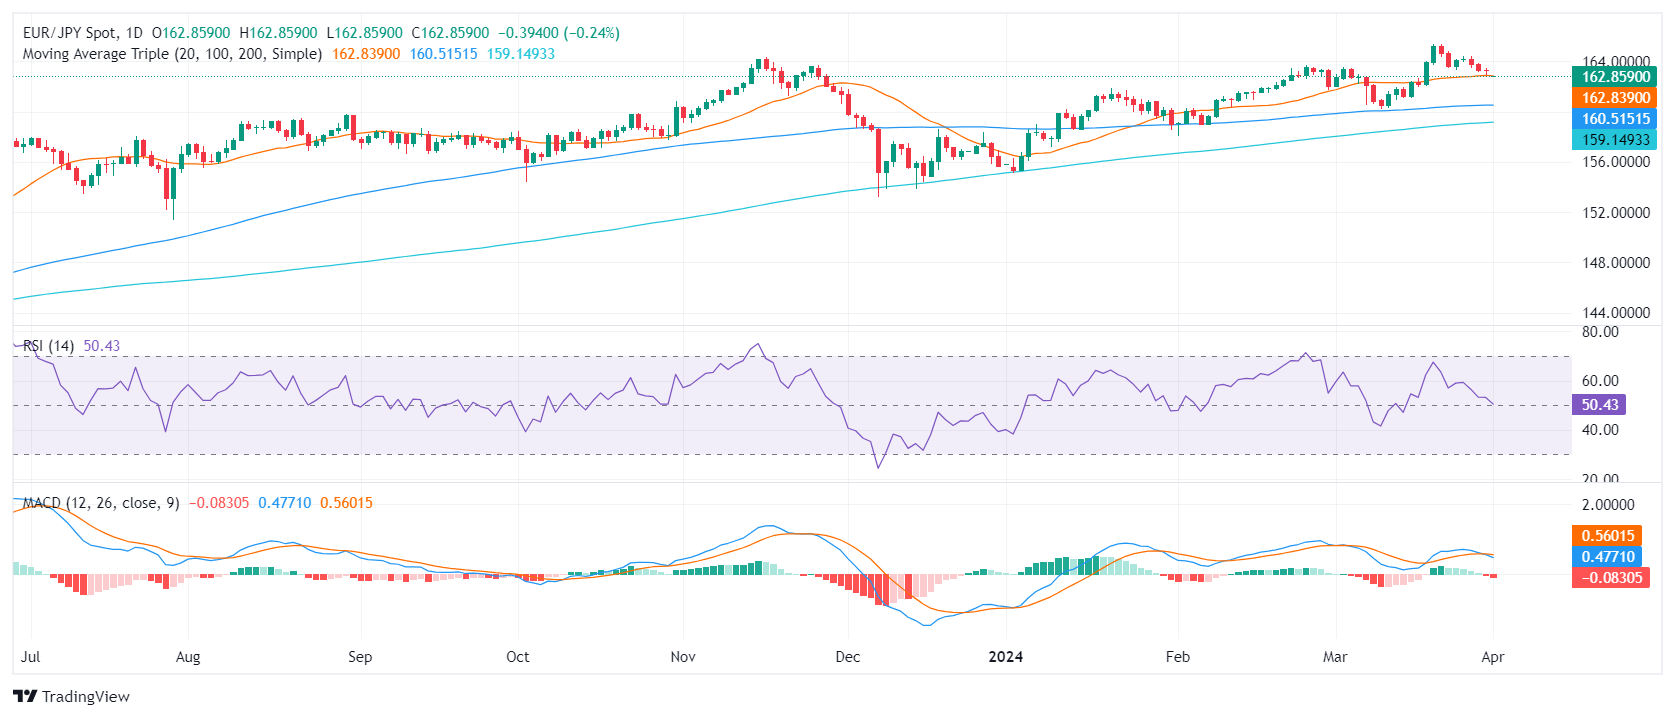
On the daily chart for EUR/JPY, the most recent Relative Strength Index (RSI) reading fell near negative territory. This situation tends to indicate a growing selling momentum. Concurrently, the Moving Average Convergence Divergence (MACD) histogram showcases rising red bars, implying a surge in negative momentum.

EUR/JPY daily chart

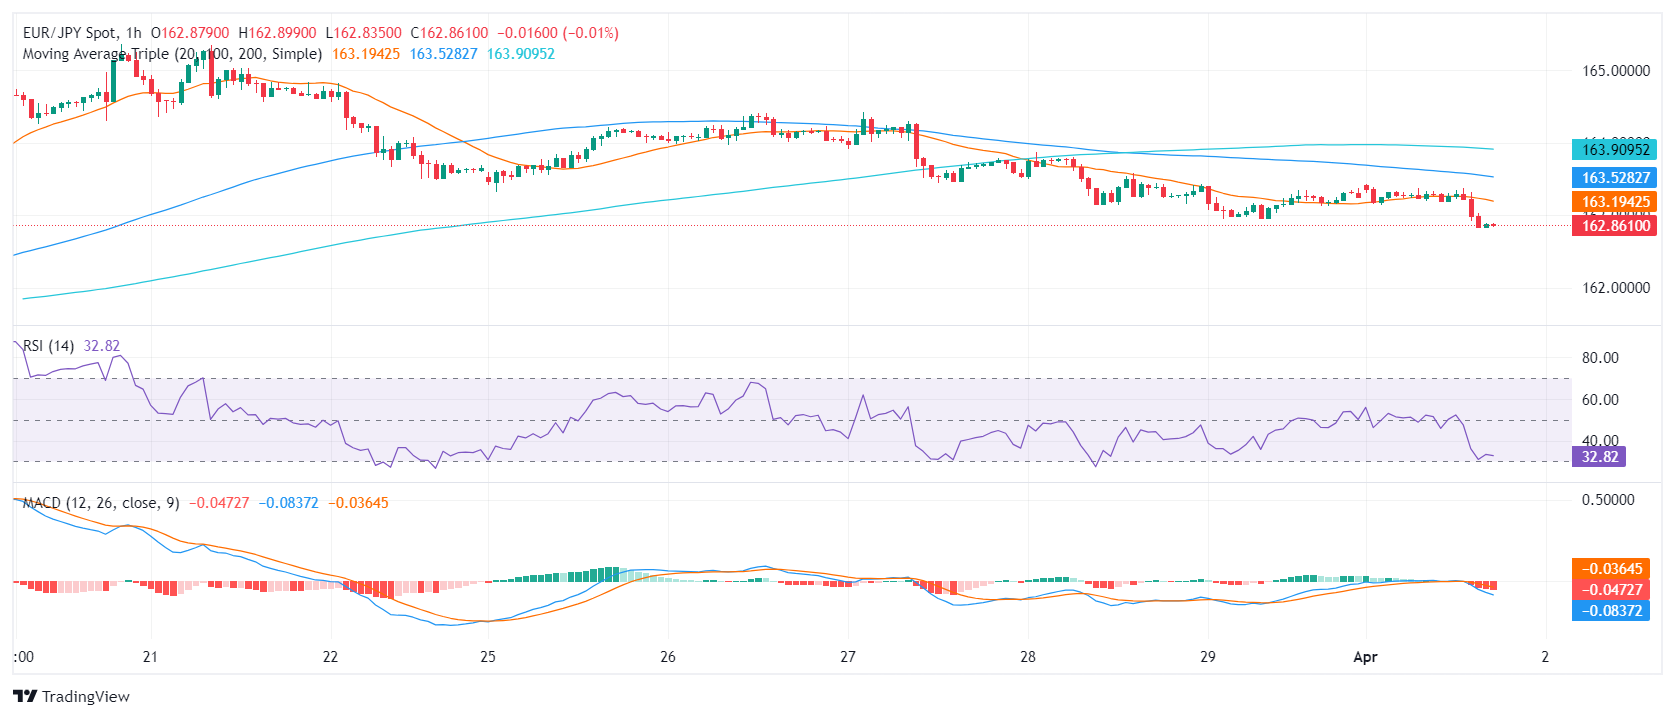
Assessing the hourly chart, the EUR/JPY pair showcases similar bearish sentiments. The RSI dipped near the oversold territory demonstrating the sellers' dominance in the market over the recent hours. Adding to this, the hourly MACD histogram reinforces this sentiment, illustrating rising red bars indicating a tilt towards negative momentum.

EUR/JPY hourly chart

Scrutinizing the broader outlook, EUR/JPY portrays a blend of bullish and bearish signals. A bullish stance manifests through its standing above the 100-day and 200-day Simple Moving Averages (SMA), revealing a positive trend for the pair in the long run. However, the cross has dipped just below the 20-day SMA today, inferring a potential bearish shift in the short term.

In summary, although the longer-term trends demonstrate a predominantly bullish stance for EUR/JPY, recent readings from both the daily and hourly charts suggest a possible shift towards a sellers' market which could fuel additional downward movements in case the buyers fail to step in.

EUR/JPY

Overview
Today last price162.87
Today Daily Change-0.38
Today Daily Change %-0.23
Today daily open163.25
 
Trends
Daily SMA20162.87
Daily SMA50161.87
Daily SMA100160.51
Daily SMA200159.12
 
Levels
Previous Daily High163.43
Previous Daily Low162.94
Previous Weekly High164.42
Previous Weekly Low162.94
Previous Monthly High165.36
Previous Monthly Low160.22
Daily Fibonacci 38.2%163.13
Daily Fibonacci 61.8%163.25
Daily Pivot Point S1162.99
Daily Pivot Point S2162.72
Daily Pivot Point S3162.5
Daily Pivot Point R1163.48
Daily Pivot Point R2163.7
Daily Pivot Point R3163.96

Author

Patricio Martín

Patricio is an economist from Argentina passionate about global finance and understanding the daily movements of the markets.

More from Patricio Martín
Share:

Markets move fast. We move first.

Orange Juice Newsletter brings you expert driven insights - not headlines. Every day on your inbox.

By subscribing you agree to our Terms and conditions.

Editor's Picks

EUR/USD bounces toward 1.1750 as US Dollar loses strength

EUR/USD returned to the 1.1750 price zone in the American session on Friday, despite falling Wall Street, which indicates risk aversion. Trading conditions remain thin following the New Year holiday and ahead of the weekend, with the focus shifting to US employment and European data scheduled for next week.

GBP/USD nears 1.3500, holds within familiar levels

After testing 1.3400 on the last day of 2025, GBP/USD managed to stage a rebound. Nevertheless, the pair finds it difficult to gather momentum and trades with modest intraday gains at around 1.3490 as market participants remain in holiday mood.

Gold trims intraday gains, approaches $4,300

Gold retreated sharply from the $4,400  area and trades flat for the day in the $4,320 price zone. Choppy trading conditions exacerbated the intraday decline, although XAU/USD bearish case is out of the picture, considering growing expectations for a dovish Fed and persistent geopolitical tensions.

Cardano gains early New Year momentum, bulls target falling wedge breakout

Cardano kicks off the New Year on a positive note and is extending gains, trading above $0.36 at the time of writing on Friday. Improving on-chain and derivatives data point to growing bullish interest, while the technical outlook keeps an upside breakout in focus.

Economic outlook 2026-2027 in advanced countries: Solidity test

After a year marked by global economic resilience and ending on a note of optimism, 2026 looks promising and could be a year of solid economic performance. In our baseline scenario, we expect most of the supportive factors at work in 2025 to continue to play a role in 2026.

Crypto market outlook for 2026

Year 2025 was volatile, as crypto often is.  Among positive catalysts were favourable regulatory changes in the U.S., rise of Digital Asset Treasuries (DAT), adoption of AI and tokenization of Real-World-Assets (RWA).