|

EUR/GBP technical analysis: Euro under pressure against Sterling, trading sub-0.9149 level

  • EUR/GBP is under pressure after peaking at the 0.9326 level.
  • The retracement down can extend towards the 0.9100 and 0.9082 supports.
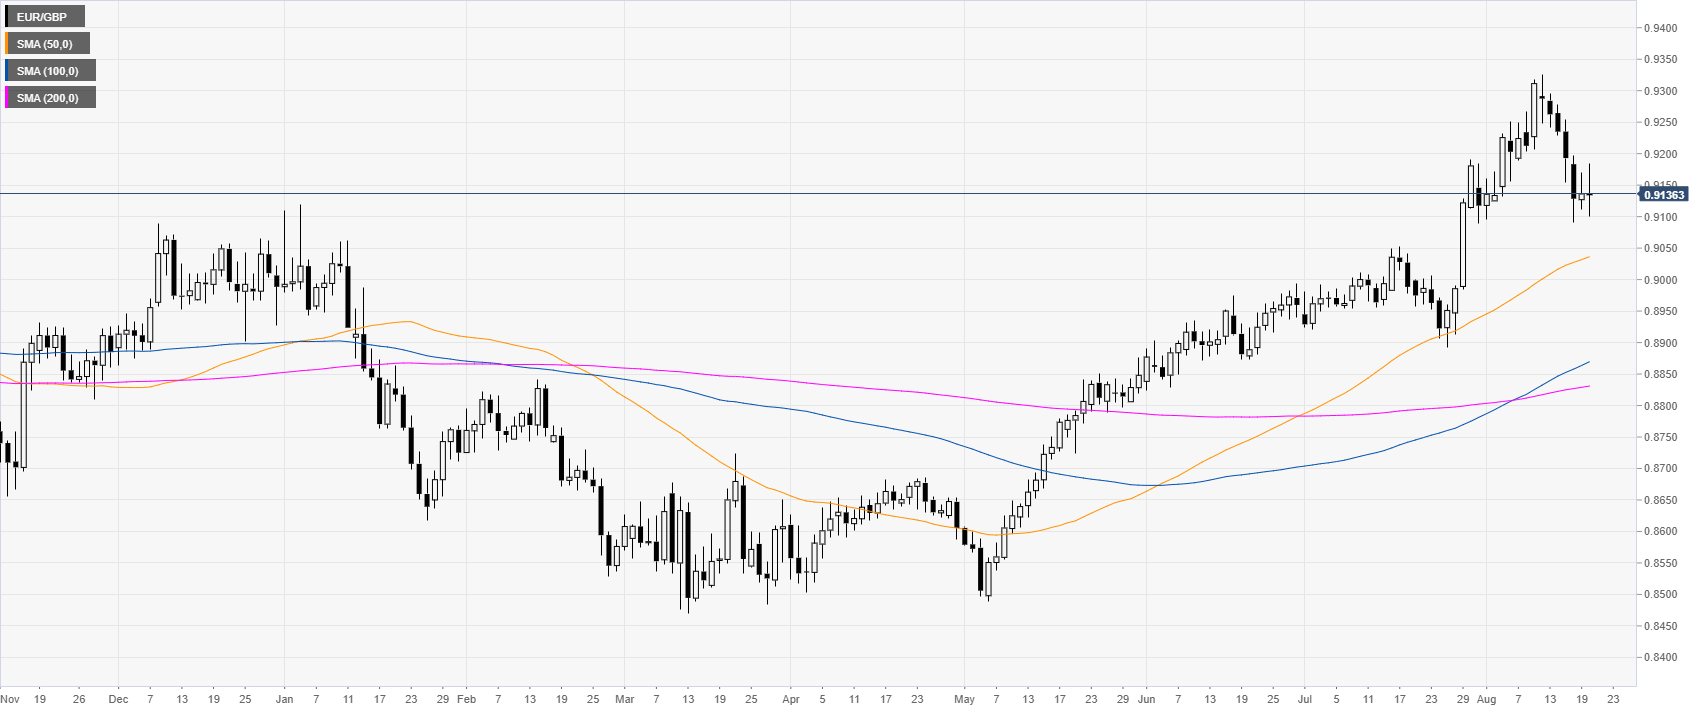
 

EUR/GBP daily chart

 
EUR/GBP is retracing down after peaking at the 0.9326 level. The market almost reached the August 29, 2017 high at the 0.9307 level. 
 

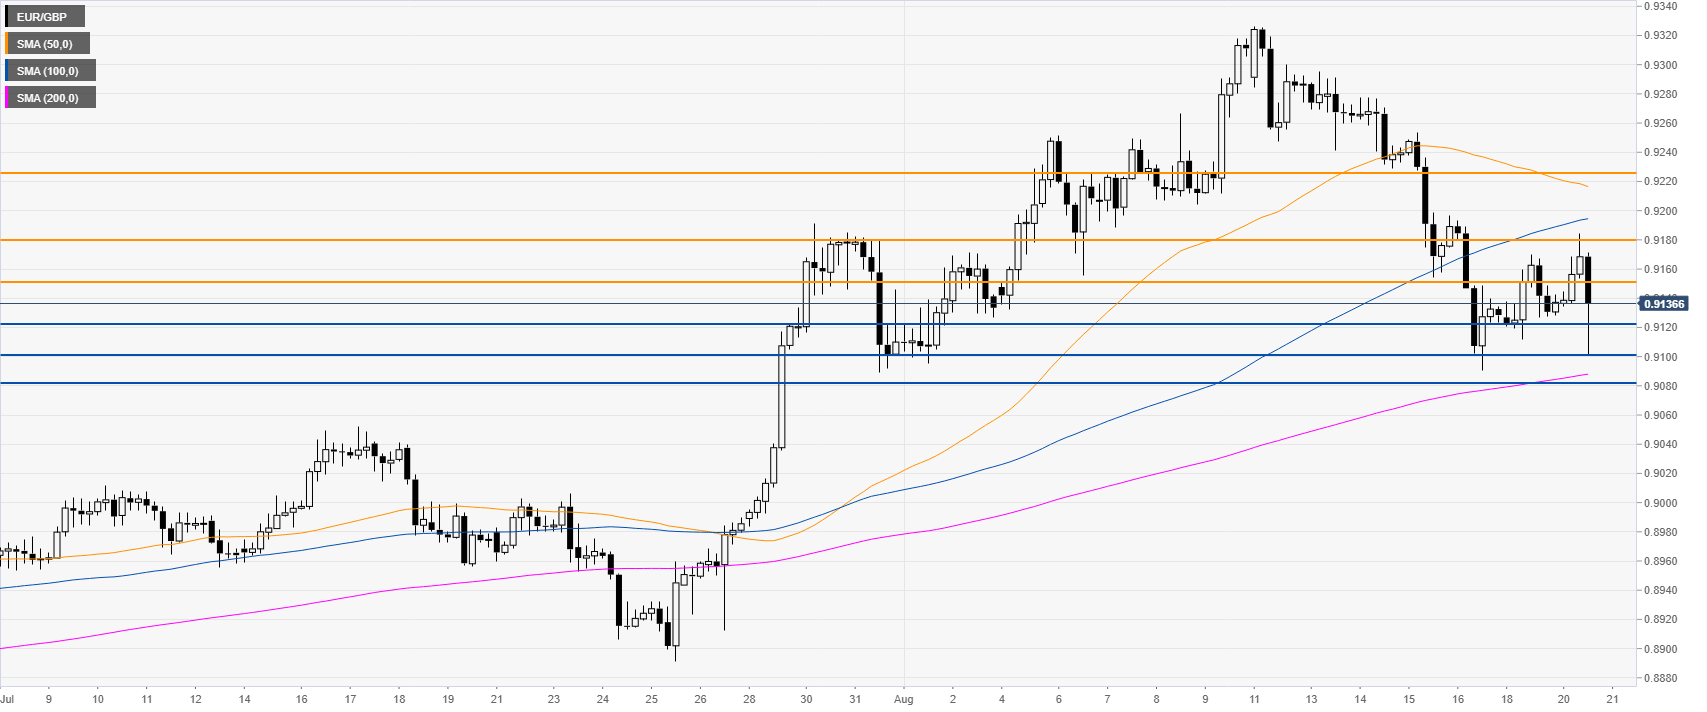
EUR/GBP 4-hour chart


EUR/GBP is losing on the backfoot below the 0.9149 resistance and the 50/100 SMAs. The market is set to decline towards 0.9100 and 0.9082, according to the Technical Confluences Indicator


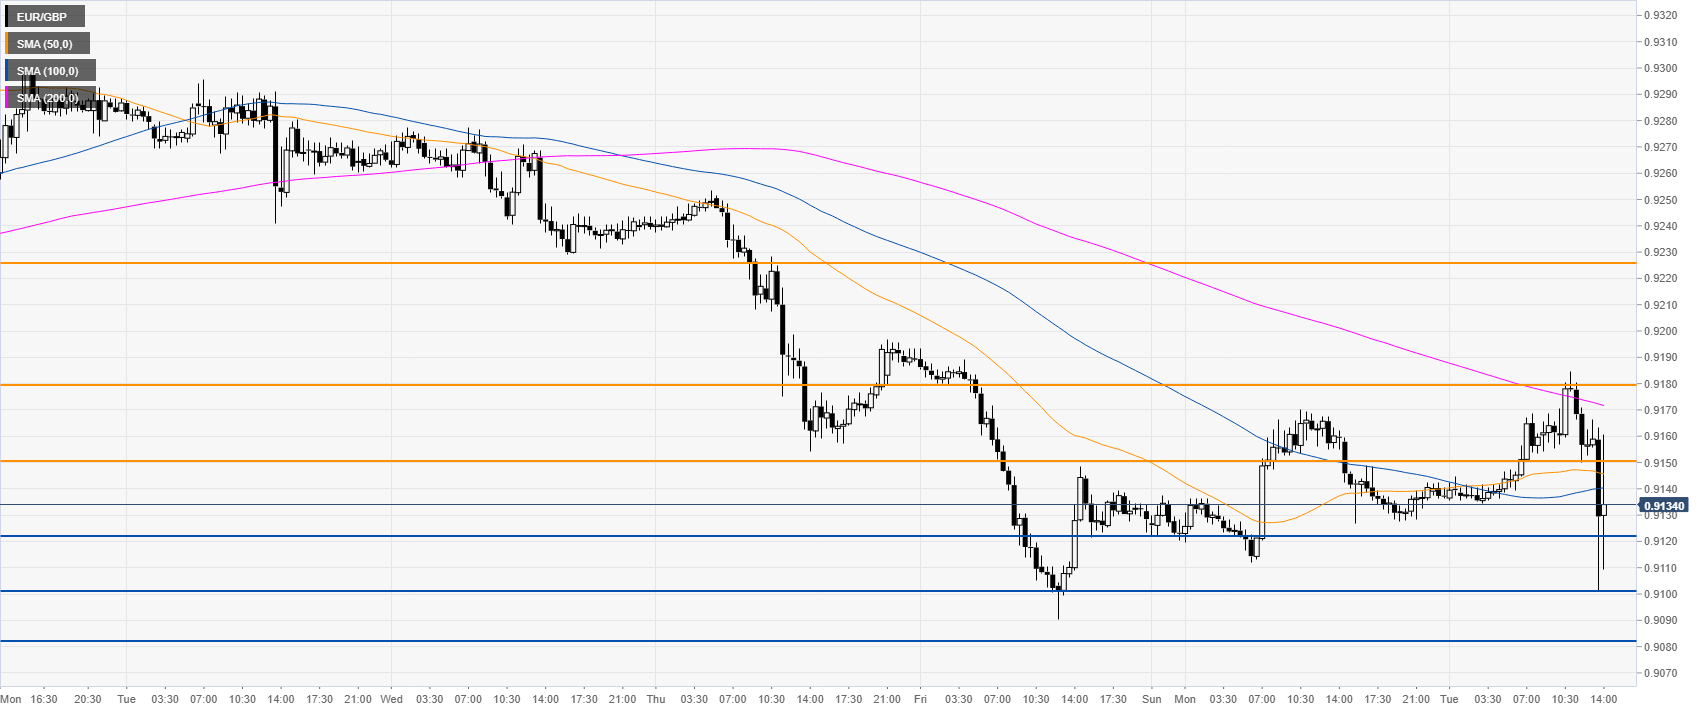
EUR/GBP 30-minute chart

 
EUR/GBP is under pressure below the main SMAs. Immediate resistances are seen at 0.9149, 0.9182 and 0.9230 according to the Technical Confluences Indicator.


Additional key levels

EUR/GBP

Overview
Today last price0.9138
Today Daily Change0.0002
Today Daily Change %0.02
Today daily open0.9136
 
Trends
Daily SMA200.9146
Daily SMA500.9032
Daily SMA1000.8864
Daily SMA2000.8829
Levels
Previous Daily High0.917
Previous Daily Low0.9112
Previous Weekly High0.9326
Previous Weekly Low0.909
Previous Monthly High0.9192
Previous Monthly Low0.8892
Daily Fibonacci 38.2%0.9148
Daily Fibonacci 61.8%0.9134
Daily Pivot Point S10.9109
Daily Pivot Point S20.9081
Daily Pivot Point S30.9051
Daily Pivot Point R10.9167
Daily Pivot Point R20.9197
Daily Pivot Point R30.9225

Author

Flavio Tosti

Flavio Tosti

Independent Analyst


More from Flavio Tosti
Share:

Editor's Picks

EUR/USD trims losses, flirts with the 1.1850 zone

EUR/USD is back on the back foot on Wednesday, slipping below the 1.1850 area as the US Dollar picks up some modest traction. The move comes as traders position ahead of a busy run of US data and the release of the FOMC Minutes. Adding to the pullback are reports that the ECB’s Lagarde may step down before completing her term.

GBP/USD flirts with daily highs near 1.3580

GBP/USD manages to set aside two consecutive daily declines and trades with slight gains in the 1.3580 zone on Wednesday. Cable’s uptick comes despite acceptable gains in the Greenback and easing UK inflation figures, which seem to have reinforced the case for a BoE rate cut in March.

Gold regains some shine, retargets $5,000 ahead of FOMC Minutes

Gold gathers fresh upside traction on Wednesday, leaving part of the weakness seen at the beginning of the week and refocusing its attention to the key $5,000 mark per troy ounce, all ahead of the release of the FOMC Minutes and despite the modest uptick in the US Dollar.

Pi Network rally defies market pressure ahead of its first anniversary

Pi Network is trading above $0.1900 at press time on Wednesday, extending the weekly gains by nearly 8% so far. The steady recovery is supported by a short-term pause in mainnet migration, which reduces pressure on the PI token supply for Centralized Exchanges. The technical outlook focuses on the $0.1919 resistance as bullish momentum increases.

Mixed UK inflation data no gamechanger for the Bank of England

Food inflation plunged in January, but service sector price pressure is proving stickier. We continue to expect Bank of England rate cuts in March and June. The latest UK inflation read is a mixed bag for the Bank of England, but we doubt it drastically changes the odds of a March rate cut.

Top 3 Price Prediction: Bitcoin, Ethereum, and Ripple face downside risk as bears regain control

Bitcoin, Ethereum, and Ripple remain under pressure on Wednesday, with the broader trend still sideways. BTC is edging below $68,000, nearing the lower consolidating boundary, while ETH and XRP also declined slightly, approaching their key supports.