|

EUR/GBP technical analysis: Euro under heavy pressure at five-month lows below the 0.8600 handle

  • EUR/GBP is under bearish pressure trading at levels not seen since May 2019. 
  • The level to beat for bears is the 0.8575 support. 
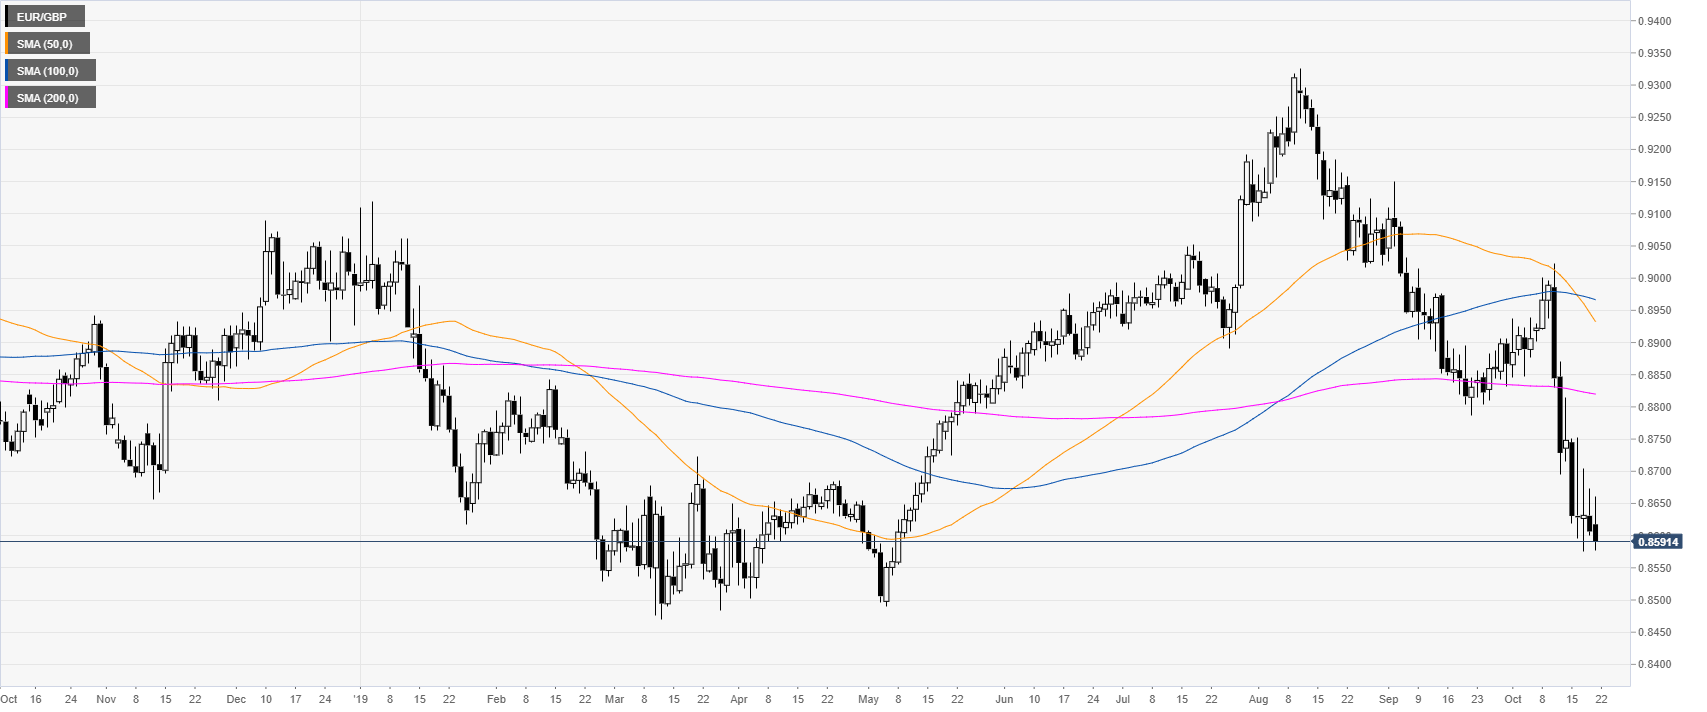
 

EUR/GBP daily chart


EUR/GBP, on the daily chart, is trading in a bear trend below its main daily simple moving averages (DSMAs). In the last week, the optimism of a Brexit deal sank the market below the 0.8600 handle. 

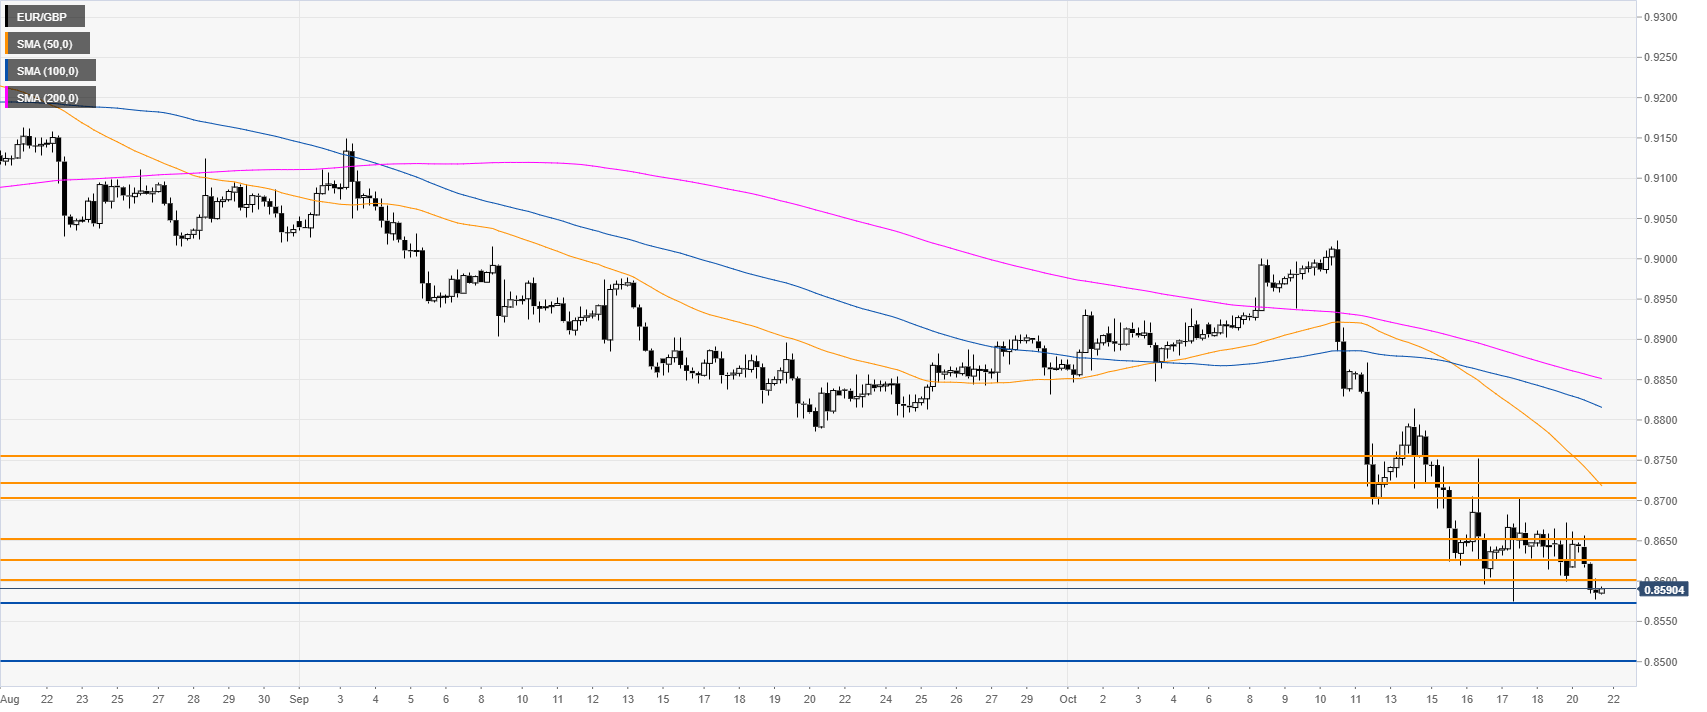
EUR/GBP four-hour chart


EUR/GBP is challenging last week lows at 0.8575 while trading below its main SMAs. A daily close below the 0.8575 support can potentially target the 0.8500 handle on the way down. 

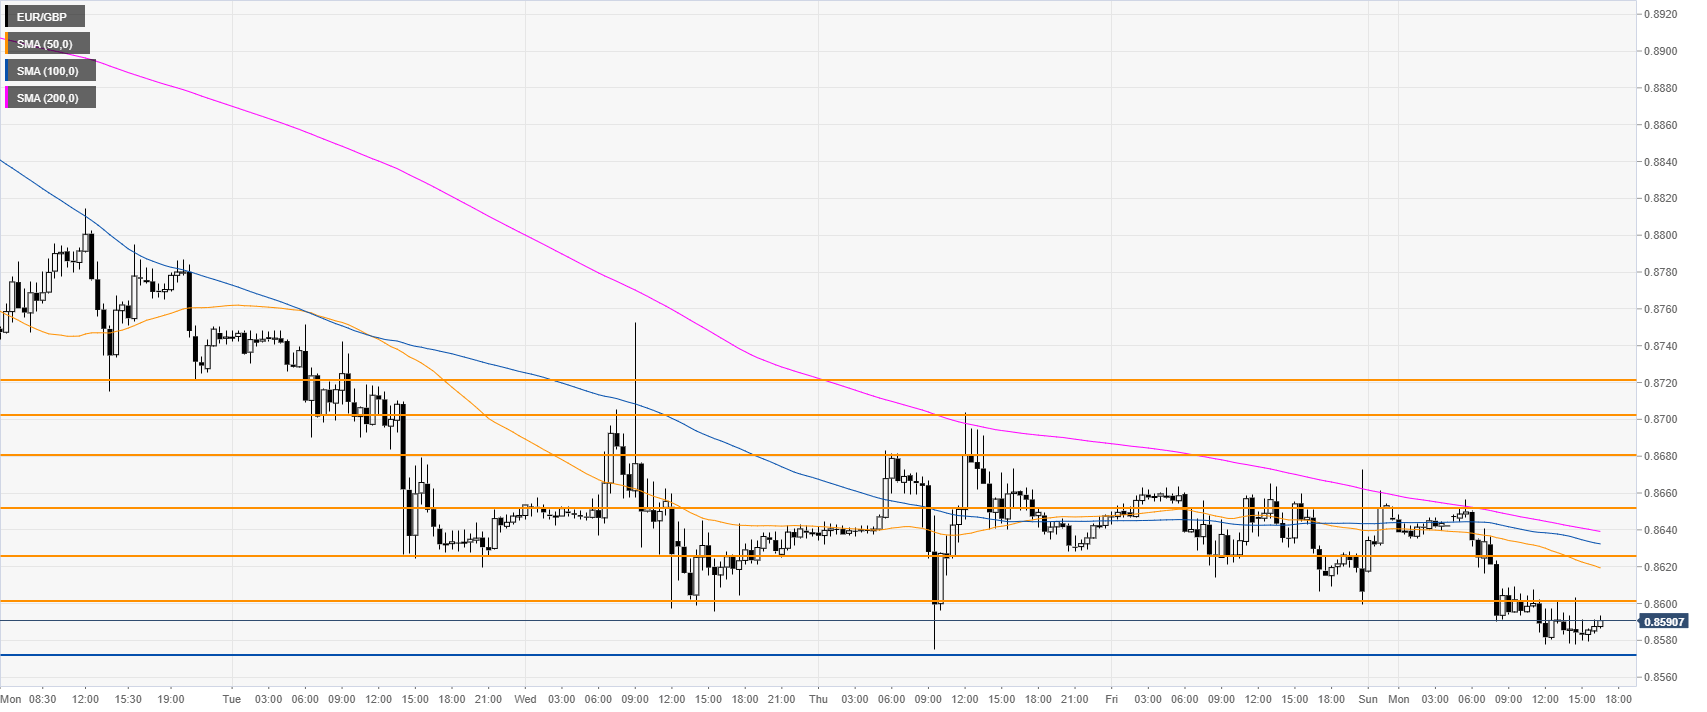
EUR/GBP 30-minute chart


EUR/GBP is trading below the main SMAs, suggesting a bearish momentum in the near term. Resistances can be seen at the 0.8600, 0.8625 and 0.8650 price levels, according to the Technical Confluences Indicator
 

Additional key levels

EUR/GBP

Overview
Today last price0.8591
Today Daily Change-0.0015
Today Daily Change %-0.17
Today daily open0.8606
 
Trends
Daily SMA200.8822
Daily SMA500.8946
Daily SMA1000.8969
Daily SMA2000.8821
 
Levels
Previous Daily High0.8672
Previous Daily Low0.86
Previous Weekly High0.8814
Previous Weekly Low0.8575
Previous Monthly High0.915
Previous Monthly Low0.8786
Daily Fibonacci 38.2%0.8627
Daily Fibonacci 61.8%0.8645
Daily Pivot Point S10.858
Daily Pivot Point S20.8553
Daily Pivot Point S30.8507
Daily Pivot Point R10.8653
Daily Pivot Point R20.8699
Daily Pivot Point R30.8726

Author

Flavio Tosti

Flavio Tosti

Independent Analyst


More from Flavio Tosti
Share:

Editor's Picks

EUR/USD flirts with weekly lows near 1.1770

EUR/USD now comes under further selling pressure, breaking below the 1.1800 support to challenge the area of weekly throughs near 1.1770 on Thursday. The pair’s decline comes in response to marked gains in the US Dollar amid steady geopolitical tensions. Ealier in the day, the ECB’s Lagarde delivered cautious remarks, although the currency remained apathetic.

GBP/USD threatens the 200-day SMA near 1.3440

GBP/USD rapidly leaves behind Wednesday’s strong advance, coming under heavy pressure and retesting the 1.3440 zone, where the critical 200-day SMA is located. Cable’s deep pullback follows the strong gains in the Greenback, while investors continue to pencil in a potential BoE rate cut in March.

Gold trims gains, slips back to around $5,170

Gold is now facing some downside pressure, hovering around the $5,170 region on Thursday. The yellow metal surrenders part of its earlier gains on the back of the resurgence of the buying interest in the Greenback. In the meantime, geopolitical tensions in the Middle East continue to limit the downside potential for now.

Stellar: Relief bounce fades as bearish undertone persists

Stellar is trading around $0.16 at the time of writing on Thursday after rebounding more than 8% in the previous day. Derivatives data paints a negative picture as XLM’s short bets hit a monthly high while Open Interest continues to decline.

Changing the game: International implications of recent tariff developments

The Supreme Court ruling on International Emergency Economic Powers Act (IEEPA) tariffs provides limited relief for the rest of the world, with weighted average tariff rates modestly lower.

Bitcoin steadies as traders eye US–Iran talks

Bitcoin (BTC) price is stabilizing around $68,000 at the time of writing on Thursday after a 6.2% relief rally the previous day amid a broader downward trend.