|

EUR/GBP technical analysis: Euro recording 11 bullish consecutive days against Pound
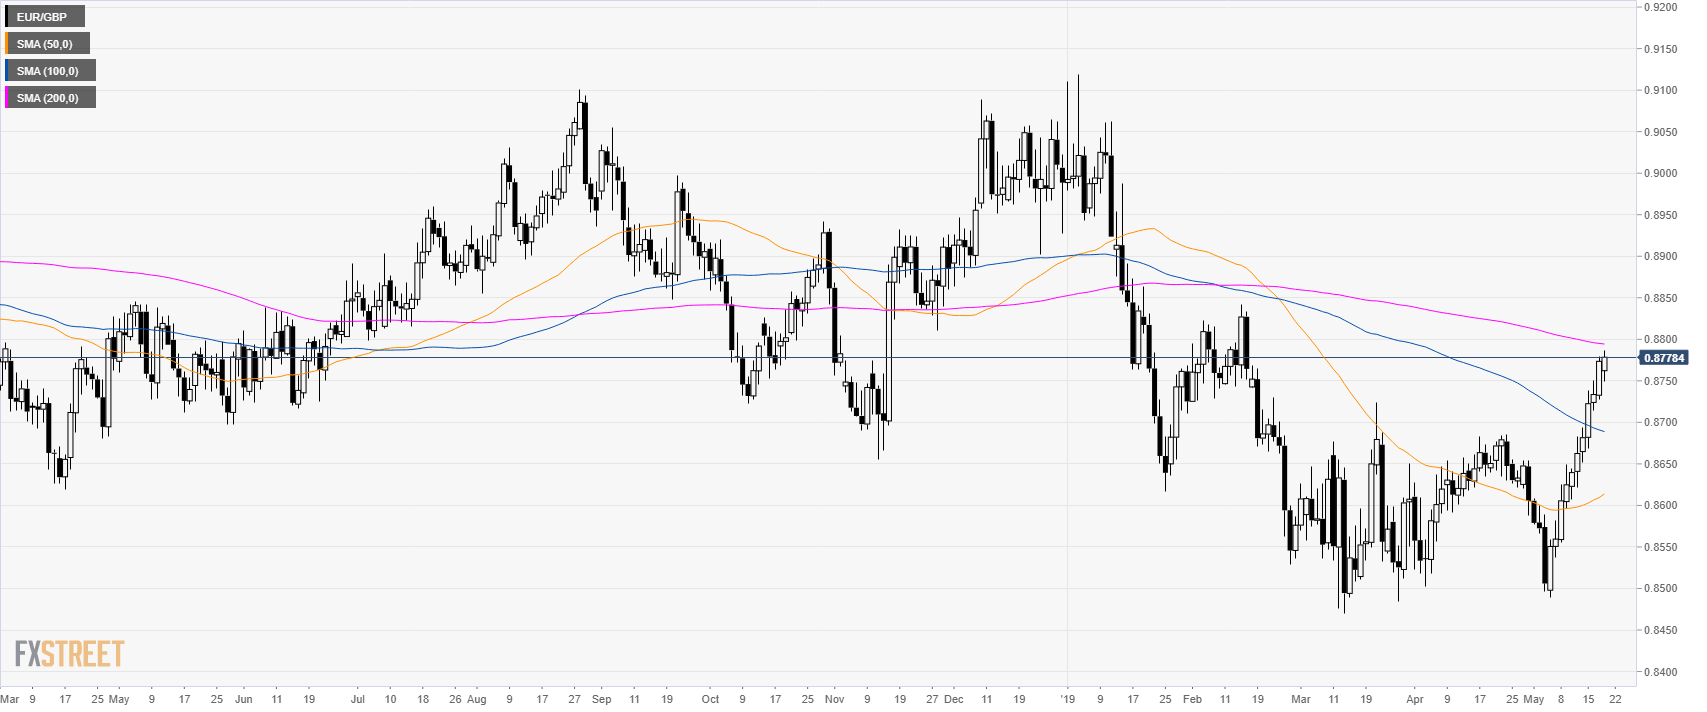
EUR/GBP daily

On the daily chart, EUR/GBP is trading in a bull leg flirting with the 200-day simple moving average (SMA) at 0.8794. 
EUR/GBP is reversing up from the 2019 low while it has been up for 11 consecutive days.

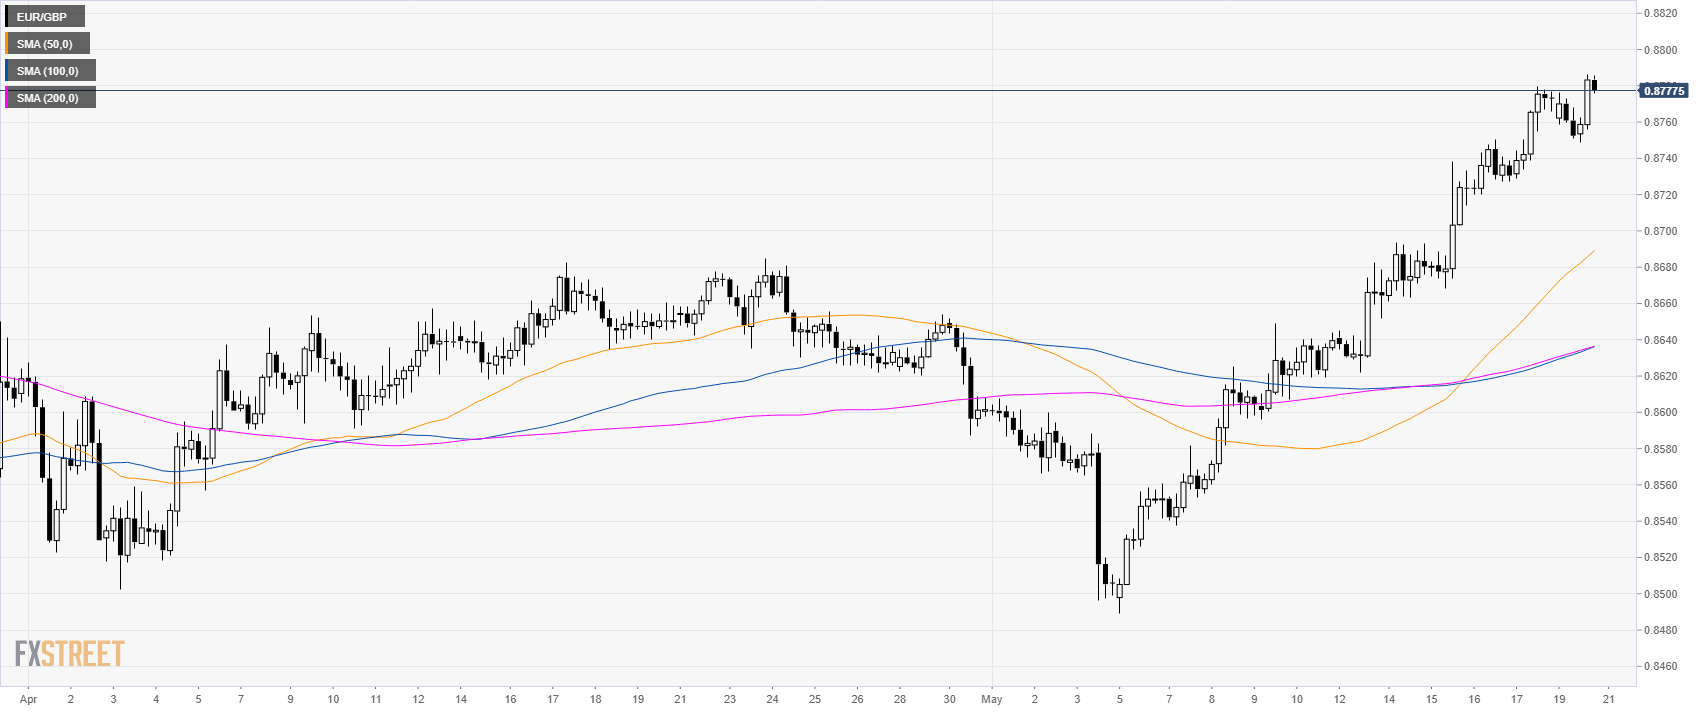
EUR/GBP 4-hour chart


EUR/GBP is trading in a bull channel above its main SMAs.

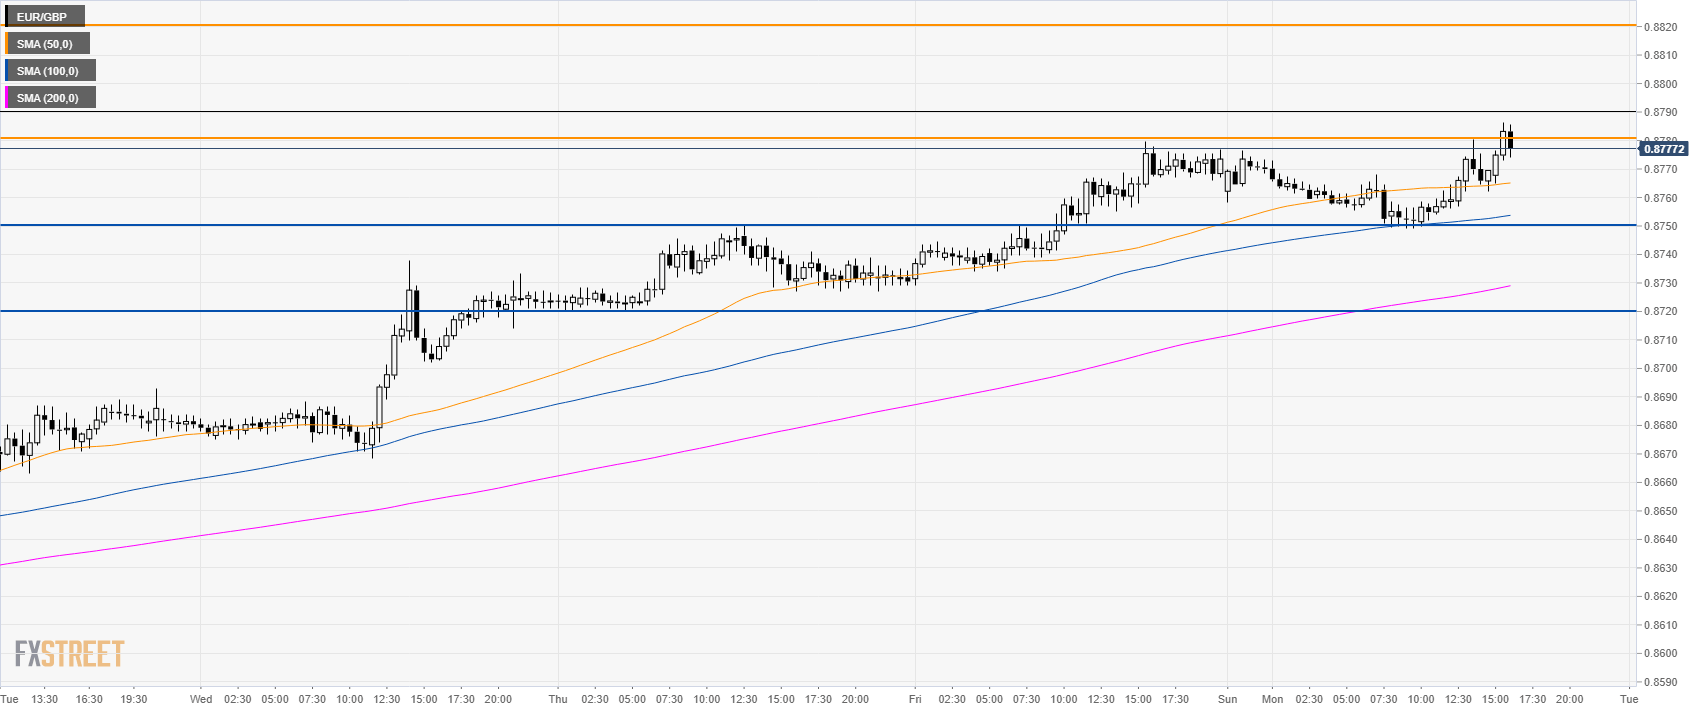
EUR/GBP 30-minute chart

EUR/GBP is trading above its main SMAs suggesting bullish momentum. The next resistance buyers will need to overcome is at 0.8780 level. If broken, bulls might set their eyes on 0.8820 level resistance. On the way down, immediate support is at the 0.8750 and 0.8620 levels.

Additional key levels

EUR/GBP

Overview
Today last price0.8779
Today Daily Change0.0005
Today Daily Change %0.06
Today daily open0.8774
 
Trends
Daily SMA200.8636
Daily SMA500.8609
Daily SMA1000.8691
Daily SMA2000.8795
Levels
Previous Daily High0.878
Previous Daily Low0.8727
Previous Weekly High0.878
Previous Weekly Low0.8622
Previous Monthly High0.8685
Previous Monthly Low0.8502
Daily Fibonacci 38.2%0.8759
Daily Fibonacci 61.8%0.8747
Daily Pivot Point S10.874
Daily Pivot Point S20.8708
Daily Pivot Point S30.8688
Daily Pivot Point R10.8793
Daily Pivot Point R20.8812
Daily Pivot Point R30.8846

Author

Flavio Tosti

Flavio Tosti

Independent Analyst


More from Flavio Tosti
Share:

Editor's Picks

EUR/USD remains cautious near 1.1760 ahead of US data

EUR/USD trades marginally on the defensive at the end of the week, hovering around the 1.1770-1.1760 band against the backdrop of an equally humble advance in the US Dollar. Meanwhile, investors gear up for the release of key US data later in the day, including PCE and GDP figures.

GBP/USD looks slightly bid near 1.3480, focus on US docket

The British Pound gathers some fresh steam on Friday, prompting GBP/USD to reverse four consecutive days of losses and revisit the 1.3480 zone. Cable’s decent bounce comes on the back of modest gains in the Greenback prior to the release of significant US data.

Gold extends the recovery past $5,000/oz, looks at US data

Gold prices advance for the third straight day on Friday, reaching new multi-day highs just north of the key $5,000 mark per troy ounce. The continuation of the precious metal’s uptick follows steady geopolitical effervescence in the Middle East, while traders eagerly await key US data releases.

US GDP growth expected to slow down significantly in Q4 after stellar Q3 

The United States Bureau of Economic Analysis will publish the first preliminary estimate of the fourth-quarter Gross Domestic Product at 13:30 GMT. Analysts forecast the US economy to have expanded at a 3% annualized rate, slowing down from the 4.4% growth posted in the previous quarter.

Week ahead – Markets brace for heightened volatility as event risk dominates

Dollar strength dominates markets as risk appetite remains subdued. A Supreme Court ruling, geopolitics and Fed developments are in focus. Pivotal Nvidia earnings on Wednesday as investors question tech sector weakness.

Official Trump price approaches breakout with mixed signals from traders

Official Trump (TRUMP) is trading at $3.50 at the time of writing, approaching its upper consolidation range. A breakout from this range could open the door for an upside move. On-chain data shows market indecision, with balanced flows between bulls and bears, signaling a lack of clear directional bias.