|

EUR/GBP Technical Analysis: Euro progresses against the Pound as the market is at 7-day’s high
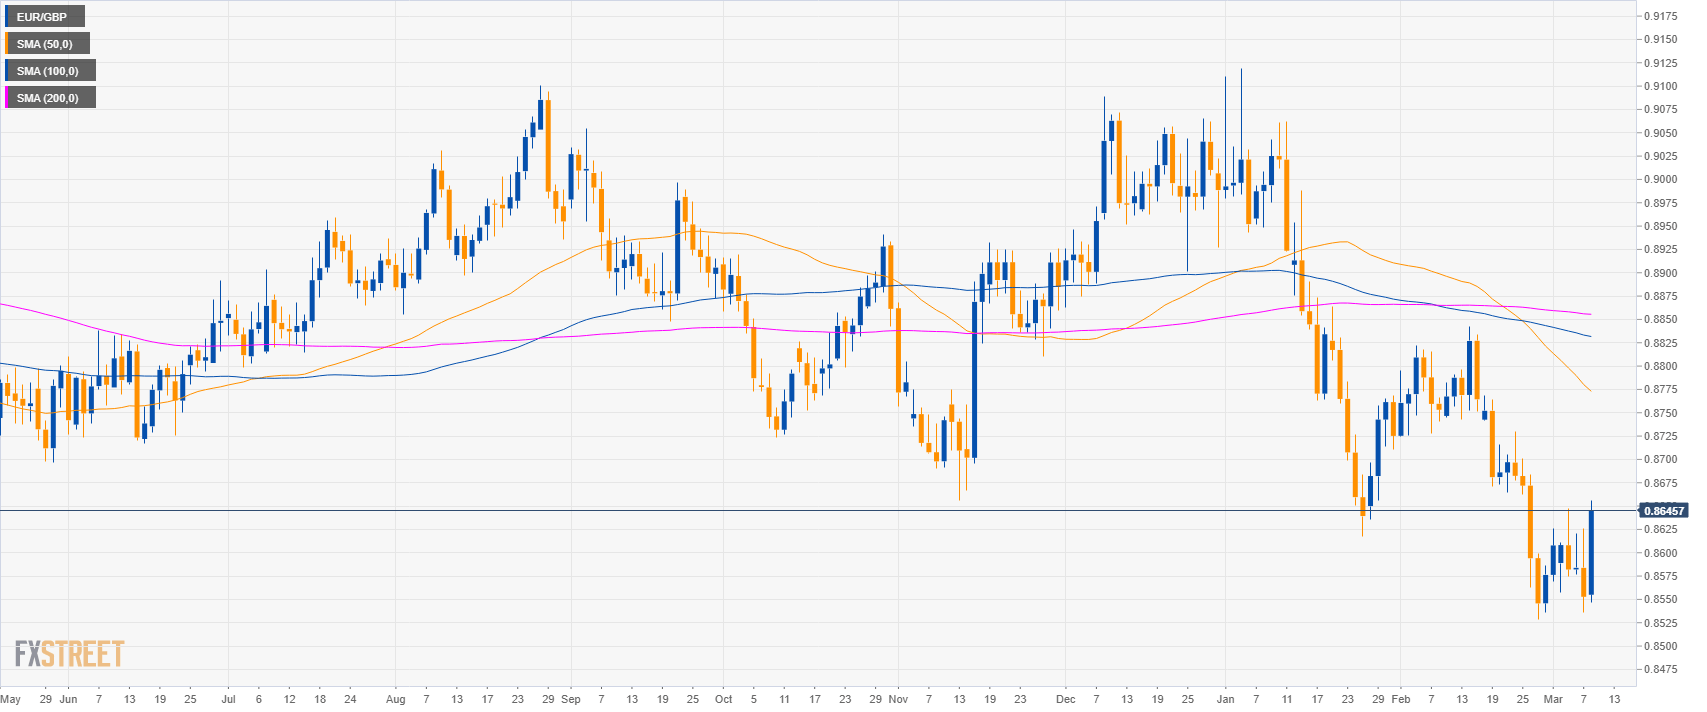
EUR/GBP daily chart

  • EUR/GBP is trading in a sideways trend below its main simple moving averages (SMAs). 

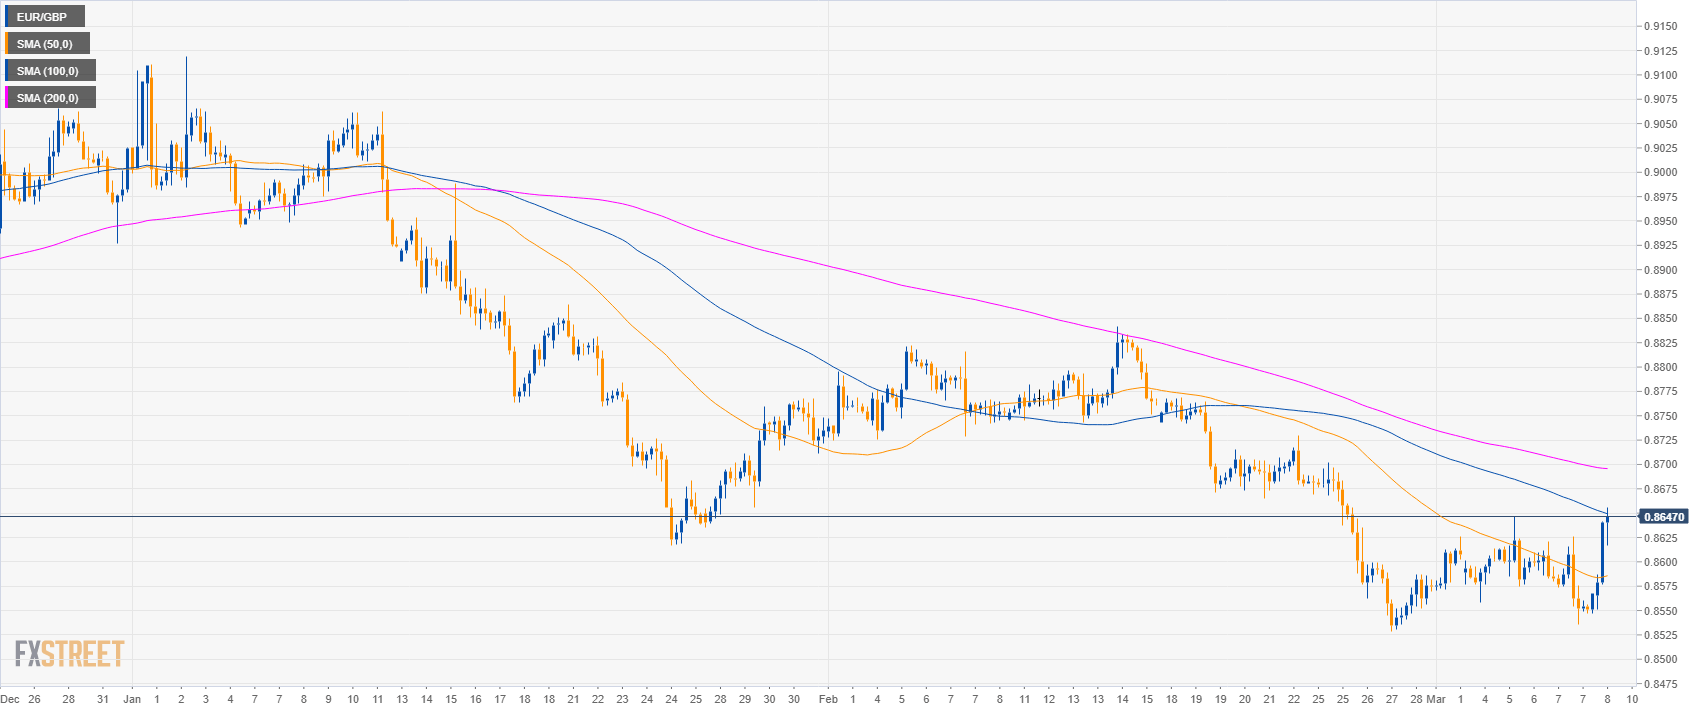
EUR/GBP 4-hour chart

  • EUR/GBP is trading between the 50 and 100 SMAs suggesting a consolidation phase in the medium-term.

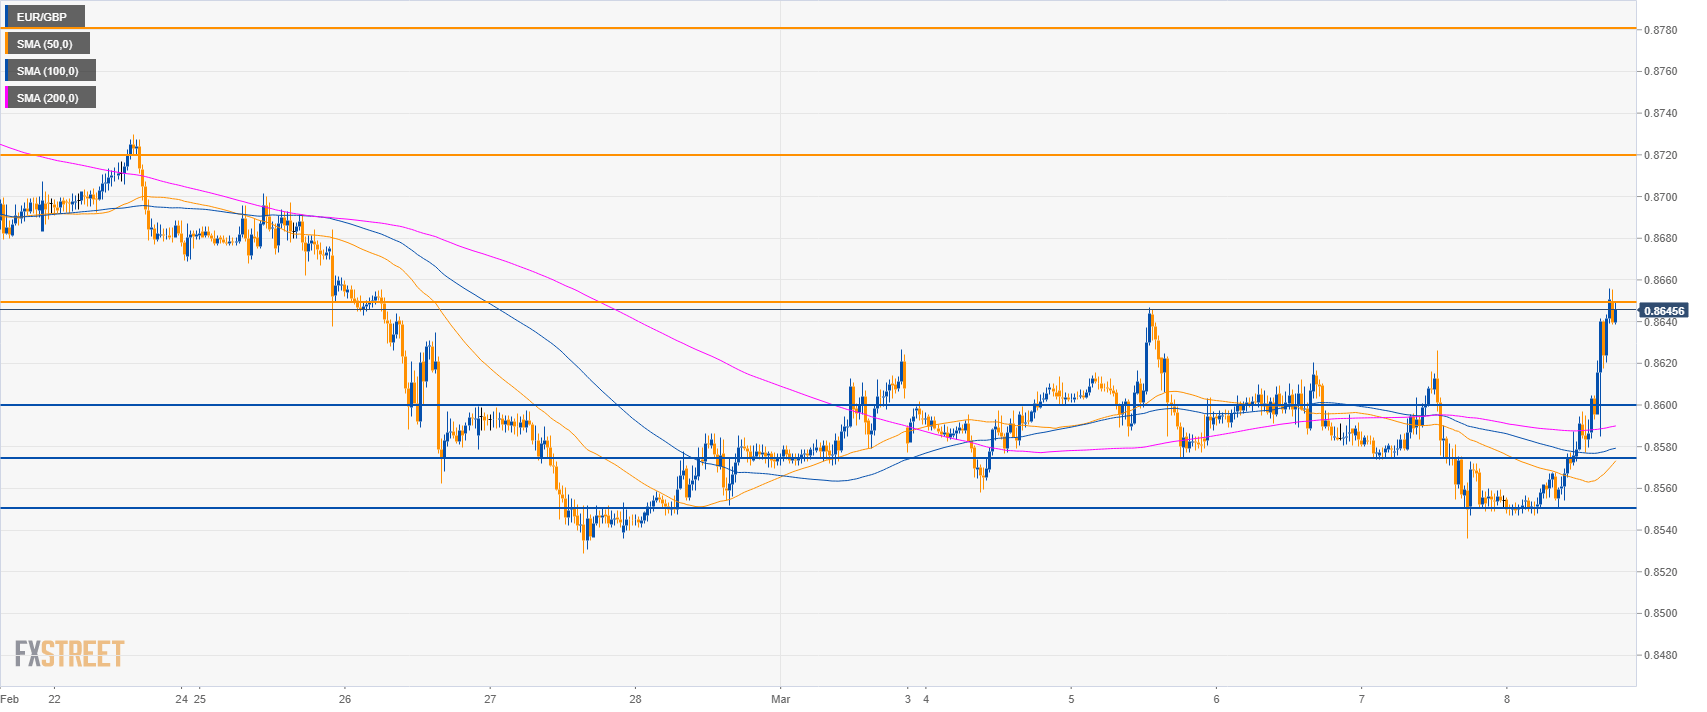
EUR/GBP 30-minute chart

  • EUR/GBP is trading above its main SMAs suggesting bullish momentum.
  • A break above 0.8650 can lead to 0.8720 and 0.8780 level. 
  • To the downside, support is at 0.8600 and 0.8580 level.

Additional key levels

EUR/GBP

Overview:
    Today Last Price: 0.8646
    Today Daily change: 93 pips
    Today Daily change %: 1.09%
    Today Daily Open: 0.8553
Trends:
    Daily SMA20: 0.8674
    Daily SMA50: 0.878
    Daily SMA100: 0.8833
    Daily SMA200: 0.8856
Levels:
    Previous Daily High: 0.8626
    Previous Daily Low: 0.8536
    Previous Weekly High: 0.8702
    Previous Weekly Low: 0.8529
    Previous Monthly High: 0.8842
    Previous Monthly Low: 0.8529
    Daily Fibonacci 38.2%: 0.857
    Daily Fibonacci 61.8%: 0.8592
    Daily Pivot Point S1: 0.8517
    Daily Pivot Point S2: 0.8482
    Daily Pivot Point S3: 0.8427
    Daily Pivot Point R1: 0.8607
    Daily Pivot Point R2: 0.8662
    Daily Pivot Point R3: 0.8697

Author

Flavio Tosti

Flavio Tosti

Independent Analyst


More from Flavio Tosti
Share:

Editor's Picks

EUR/USD recovers some early losses driven by rising energy prices amid US-Iran war

The EUR/USD pair claws back some of its early losses during the late Asian trading session on Monday, but is still 0.25% down to near 1.1780. Earlier in the day, the Euro declined sharply against the US Dollar as investors shifted to the safe-haven fleet amid the brutal war between Iran, Israel, and the United States, which broke out over the weekend.

GBP/USD targets 1.3500 barrier near moving averages

GBP/USD rebounds from the daily losses, trading around 1.3450 during the Asian hours on Monday. The technical analysis of the daily chart indicates an ongoing bearish bias, as the pair trades within a descending channel pattern.

Gold looks further north as Iran war boosts haven demand

Gold is taking a breather after the initial run to over one-month highs near $5,400, kicking off the new week with a bang. A global flight to safety theme, following the US-Israel joint attacks on Iran over the weekend, bolstered the demand for the traditional store of value, Gold.

Bitcoin, Ethereum and Ripple under pressure as key supports face breakdown risk

Bitcoin, Ethereum, and Ripple prices trade on the back foot at the start of this week on Monday, after extending losses in the previous week. BTC is on the brink of a breakdown, ETH is capped below key resistance, and XRP risks a crack of the trendline.

The market is paying for insurance, not apocalypse

As expected, this morning felt less like a Monday market open and more like a fire drill. Futures screens flickered red. S&P contracts down almost 1%. Nasdaq off 1.2%. Brent leaped 13% through $80. Gold rose 1.6% toward $5350 before paring some gains. The dollar is strutting mildly. The Swiss franc is quietly doing what it always does in a storm, catching some safe-haven flows.

Starknet unveils strkBTC, shielded Bitcoin transactions on Ethereum Layer 2

Starknet, the Ethereum Layer 2 network developed by StarkWare, today announced strkBTC, a wrapped Bitcoin asset that introduces optional shielding while preserving full DeFi composability.