|

EUR/GBP Technical Analysis: Euro is trading up near key resistance at 0.8780 level
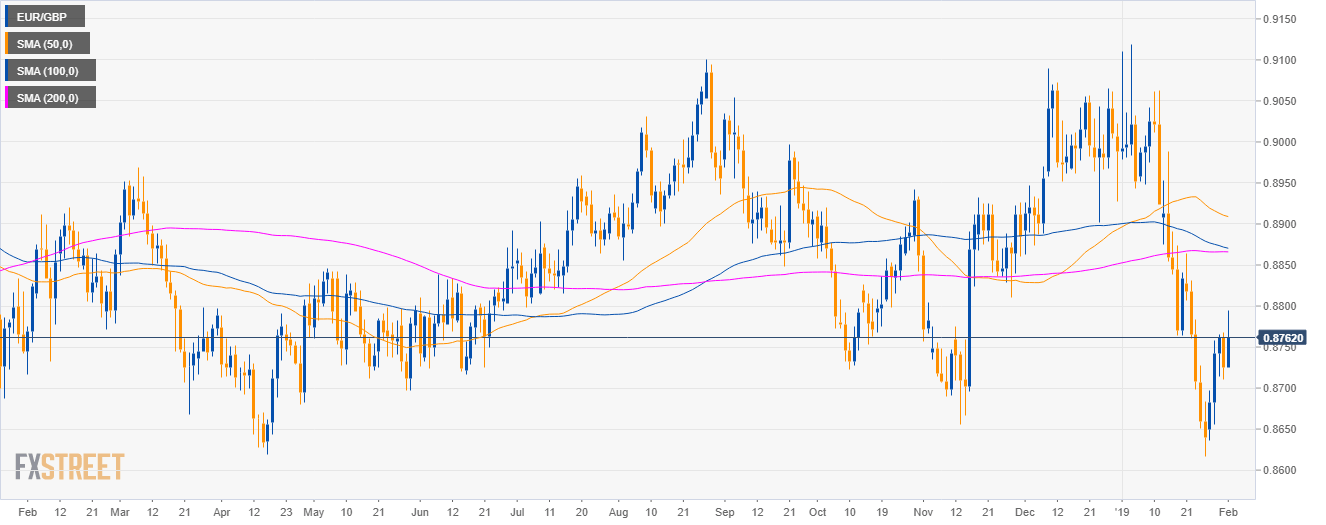
EUR/GBP daily chart

  • EUR/GBP is trading in a sideways trend below the 50, 100 and 200-day simple moving averages (SMAs).


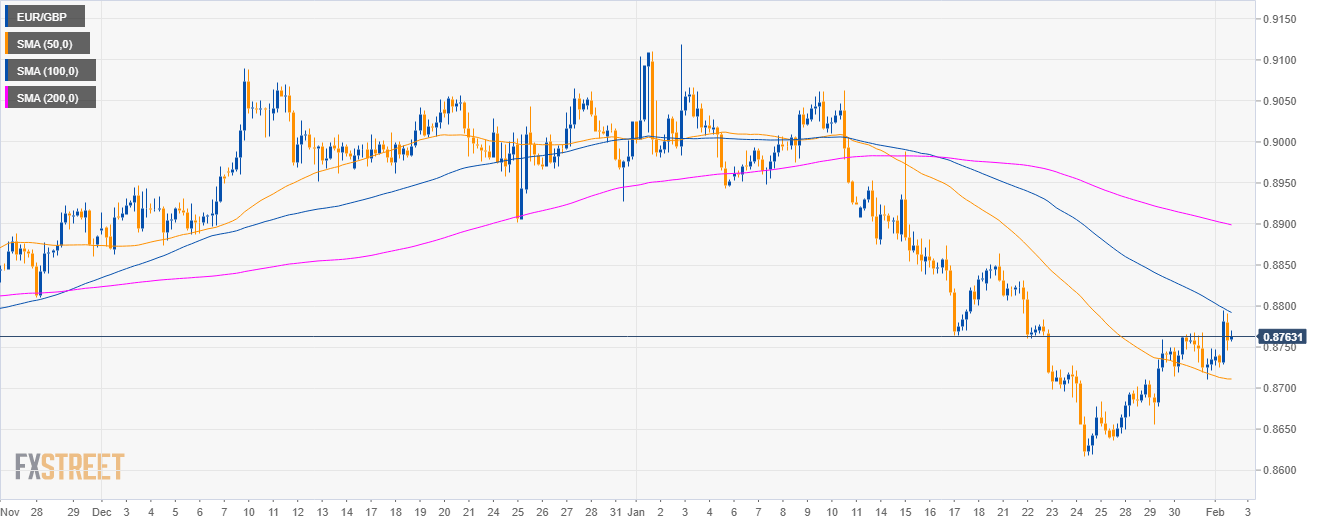
EUR/GBP 4-hour chart

  • EUR/GBP is trading below the 100 and 200 SMA on the 4-hour chart.

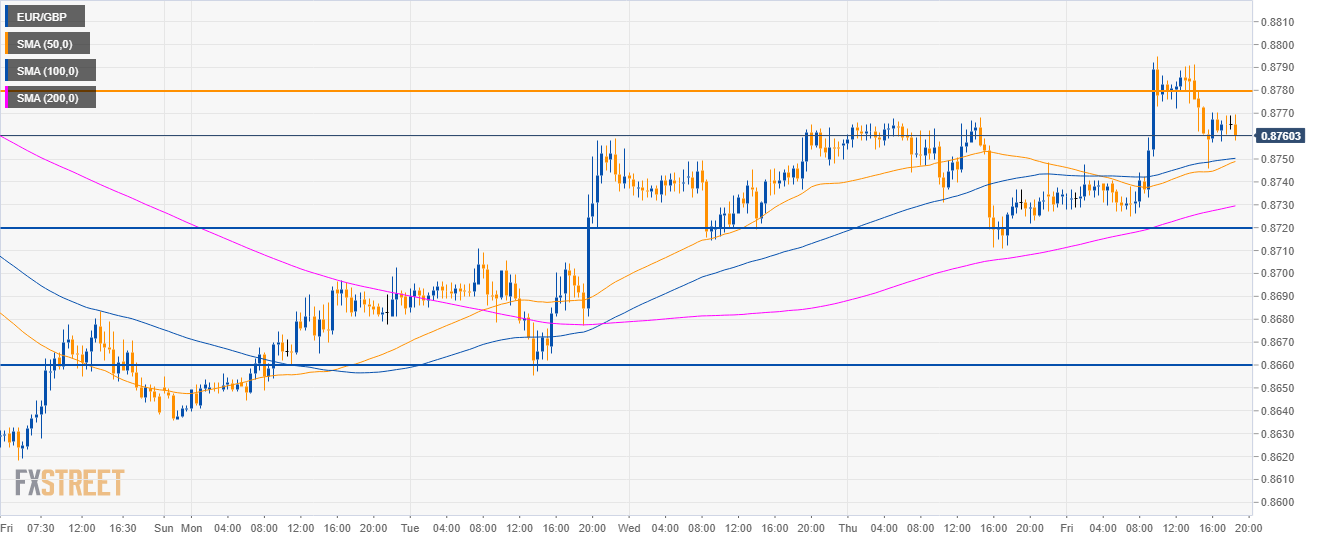
EUR/GBP 30-minute chart

  • EUR/GBP is having bullish momentum on lower-time frames.
  • If Euro bulls are able to break above 0.8780 key resistance, they can expect a run to 0.8840 level.
  • To the downside, support is at 0.8720 and 0.8660 level.

Additional key levels

EUR/GBP

Overview:
    Today Last Price: 0.8761
    Today Daily change: 36 pips
    Today Daily change %: 0.41%
    Today Daily Open: 0.8725
Trends:
    Daily SMA20: 0.8831
    Daily SMA50: 0.8911
    Daily SMA100: 0.8872
    Daily SMA200: 0.8866
Levels:
    Previous Daily High: 0.8768
    Previous Daily Low: 0.8711
    Previous Weekly High: 0.8864
    Previous Weekly Low: 0.8617
    Previous Monthly High: 0.9119
    Previous Monthly Low: 0.8617
    Daily Fibonacci 38.2%: 0.8733
    Daily Fibonacci 61.8%: 0.8746
    Daily Pivot Point S1: 0.8701
    Daily Pivot Point S2: 0.8678
    Daily Pivot Point S3: 0.8644
    Daily Pivot Point R1: 0.8758
    Daily Pivot Point R2: 0.8792
    Daily Pivot Point R3: 0.8815

Author

Flavio Tosti

Flavio Tosti

Independent Analyst


More from Flavio Tosti
Share:

Editor's Picks

EUR/USD extends losses toward 1.1600 ahead of EU inflation data

EUR/USD extends the decline toward 1.1600 in the European session on Tuesday. The pair remains under pressure as surging energy prices amid the US-Iran war have increased the risks of higher inflation for the Old Continent. The focus is now on the Eurozone preliminary inflation reading for February. 

GBP/USD drops back toward three-month lows below 1.3350

GBP/USD is back in the red, accelerating its downside toward the three-month lows of 1.3315 in European trading on Tuesday. The ongoing escalation in the Iran war, combined with rising Oil prices, weighs negatively on the higher-yielding Pound Sterling as the US Dollar preserves the previous upside. 

Gold weakens below $5,300 as sustained USD buying counter Middle East tensions

Gold attracts some intraday selling and falls around $100 from the daily top, around the $5,380 area. The US Dollar climbs to a fresh high since January 20 and turns  out to be a key factor exerting downward pressure on the commodity. However, concerns about a broader regional conflict in the Middle East continue to weigh on investors' sentiment and underpin demand for the traditional safe-haven bullion.

Stellar risks deeper losses as derivatives metrics turn negative

Stellar is trading red below $0.16 at the time of writing on Tuesday, after a slight recovery the previous day. Weakening derivatives data caps the recovery, while an unfavorable technical outlook projects a deeper correction for the XLM token in the upcoming days.

The market is not panicking it is repricing the probability distribution of Oil and time

At the end of the day, markets do not trade morality or geopolitics. They trade transmission channels. And the only channel that truly matters in this maelstrom runs through the price of energy and the time value of money.

Hyperliquid Price Forecast: HYPE rises on commodities demand amid US-Iran war

Hyperliquid (HYPE) steadies above $33 at press time on Tuesday, marking its fourth consecutive day of recovery in a broadly volatile market due to the ongoing US-Israel strikes on Iran.