EUR/GBP Technical Analysis: Euro is holding above the 0.9000 figure

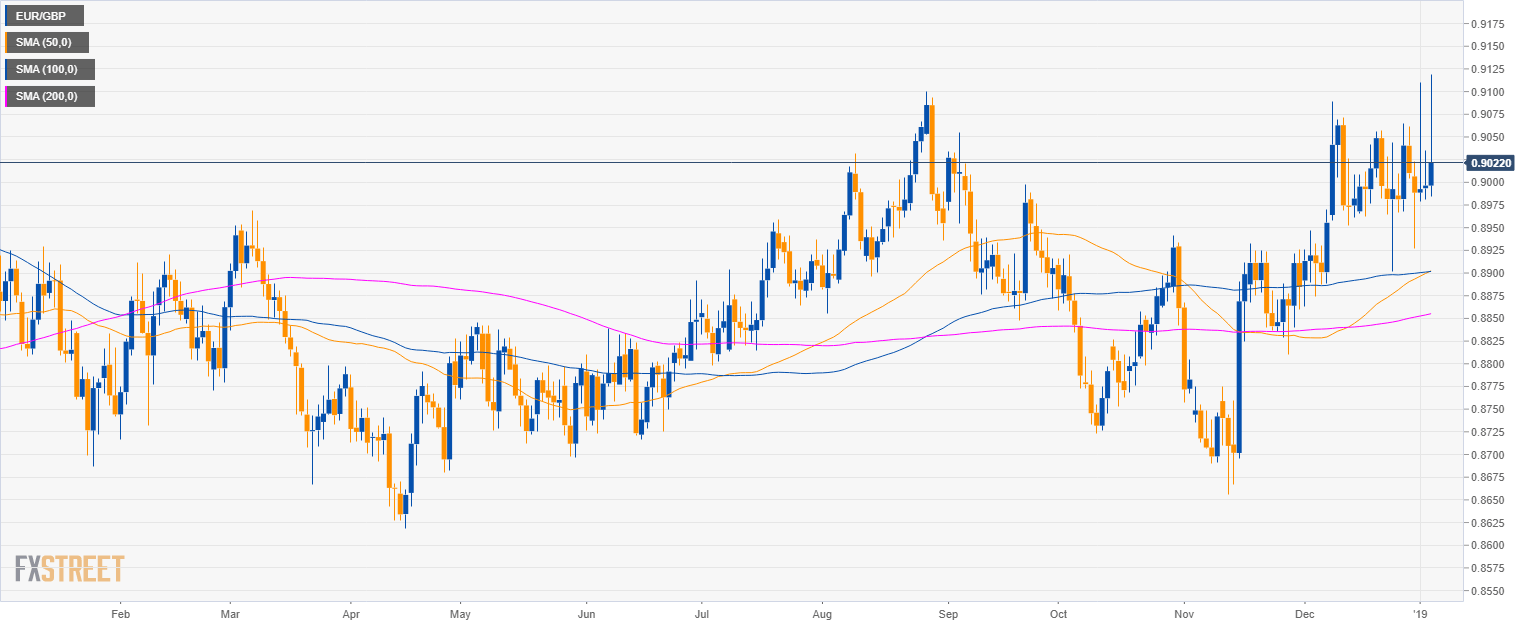
EUR/GBP daily chart
- EUR/GBP is trading in a sideways trend above the 200-period simple moving average (SMA).
- The action has been mainly choppy since December 2018.
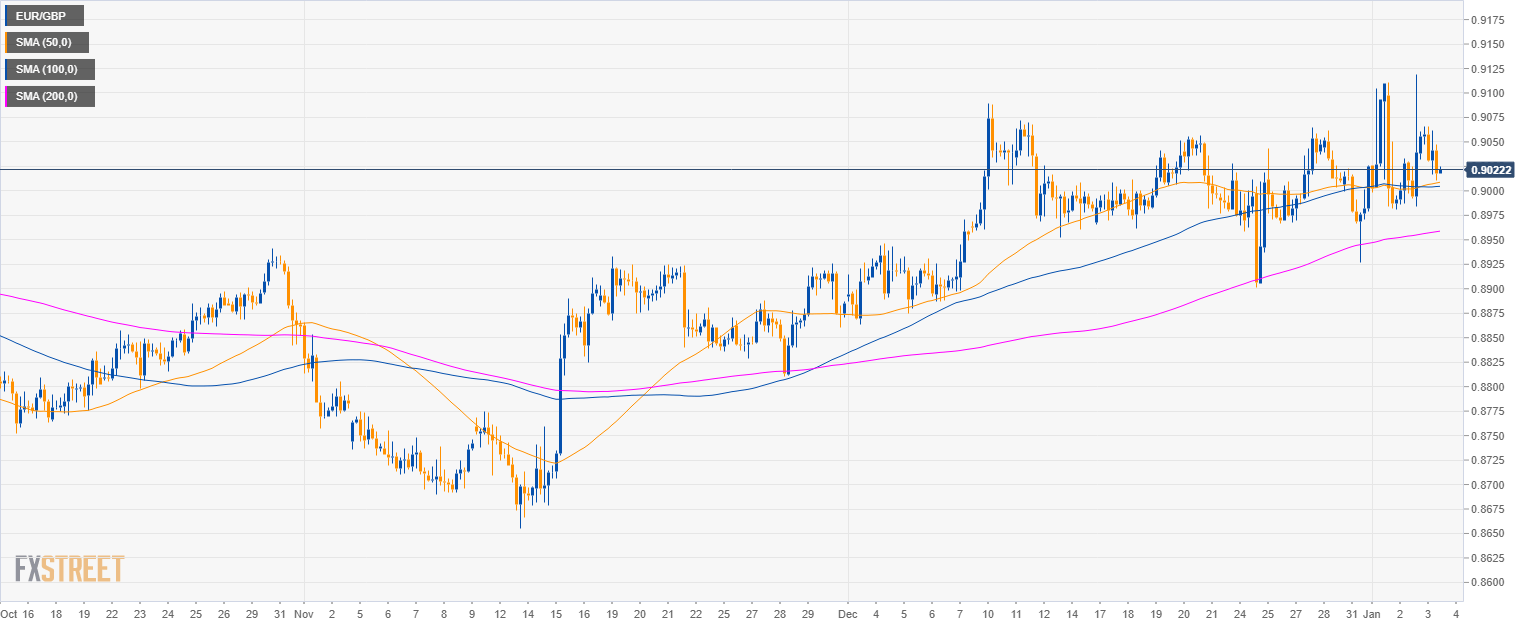
EUR/GBP 4-hour chart
- EUR/GBP is trading above its main SMAs suggesting that the current momentum is bullish.
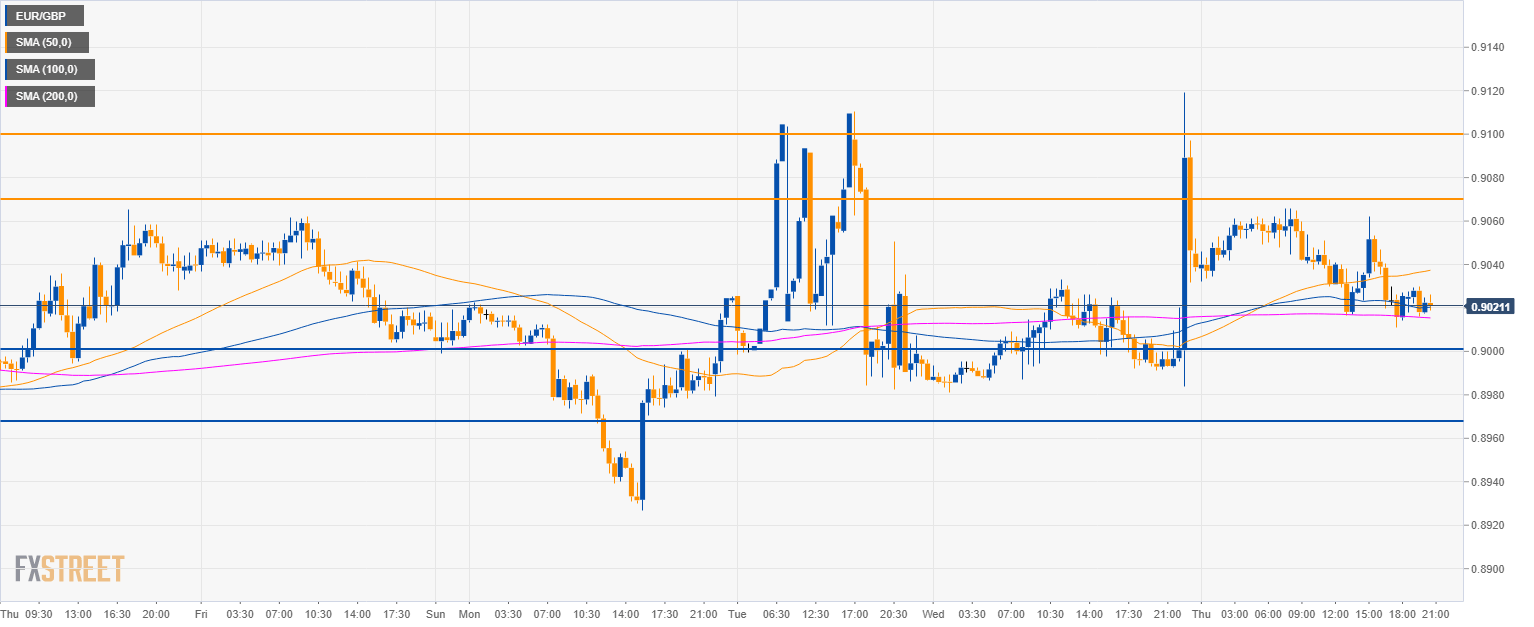
EUR/GBP 30-minute chart
- EUR/GBP is resting above the 0.9000 figure and 200 SMA.
- The level to beat for bulls is 0.9070 which could lead to 0.9100 if broken. On the flip side, support is seen near 0.9000 figure and the 0.8960 level.
Additional key levels
EUR/GBP
Overview:
Today Last Price: 0.9022
Today Daily change: 26 pips
Today Daily change %: 0.289%
Today Daily Open: 0.8996
Trends:
Previous Daily SMA20: 0.8996
Previous Daily SMA50: 0.89
Previous Daily SMA100: 0.8901
Previous Daily SMA200: 0.8854
Levels:
Previous Daily High: 0.9036
Previous Daily Low: 0.8981
Previous Weekly High: 0.9065
Previous Weekly Low: 0.8902
Previous Monthly High: 0.9089
Previous Monthly Low: 0.8863
Previous Daily Fibonacci 38.2%: 0.9015
Previous Daily Fibonacci 61.8%: 0.9002
Previous Daily Pivot Point S1: 0.8973
Previous Daily Pivot Point S2: 0.895
Previous Daily Pivot Point S3: 0.8919
Previous Daily Pivot Point R1: 0.9028
Previous Daily Pivot Point R2: 0.9059
Previous Daily Pivot Point R3: 0.9082
Author

Flavio Tosti
Independent Analyst


