|

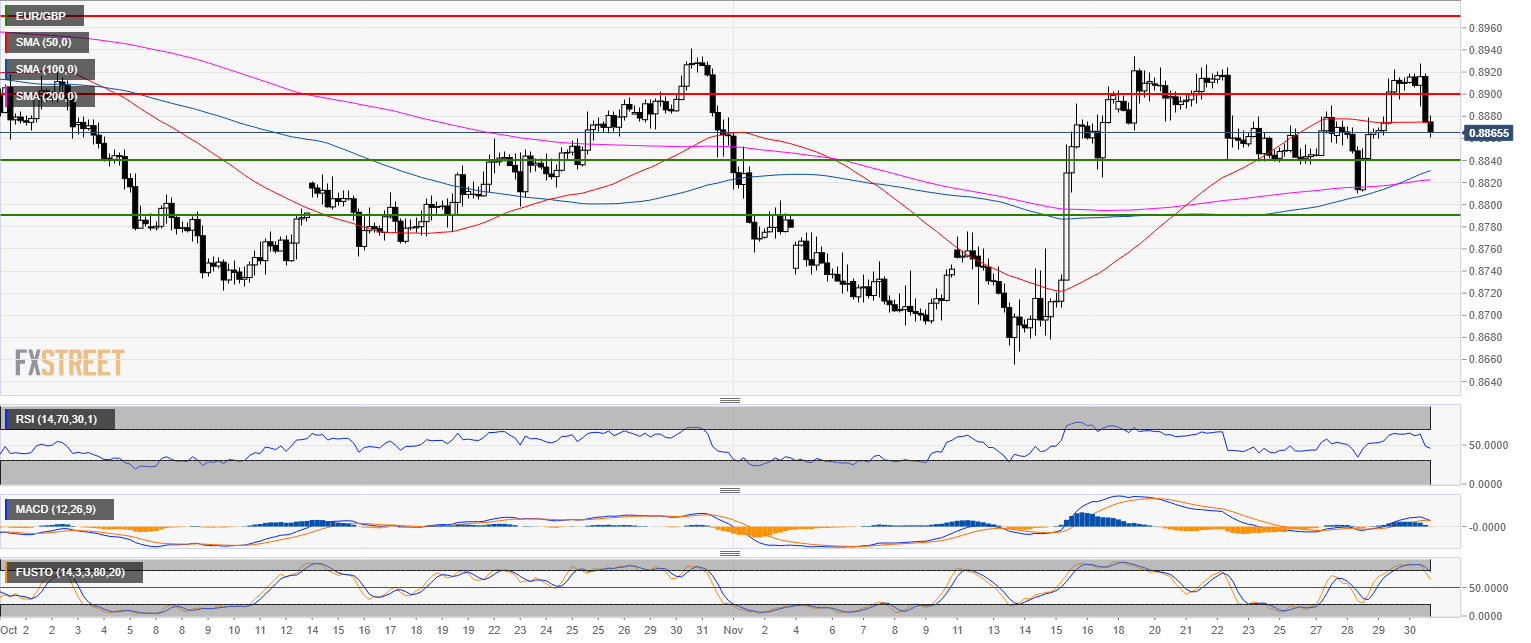
EUR/GBP Technical Analysis: Euro dropping against the British Pound en route to the 0.8840 level

EUR/GBP 4-hour chart

  • EUR/GBP is trading in a bull trend above the 200-period simple moving average (SMA).
  • EUR/GBP slipped through the 0.8900 figure as technical indicators are weakening.
  • The next target to the downside is likely located near the 0.8840 level. 

Additional key levels 

EUR/GBP

Overview:
    Today Last Price: 0.8861
    Today Daily change: -50 pips
    Today Daily change %: -0.561%
    Today Daily Open: 0.8911
Trends:
    Previous Daily SMA20: 0.8811
    Previous Daily SMA50: 0.8832
    Previous Daily SMA100: 0.8885
    Previous Daily SMA200: 0.8836
Levels:
    Previous Daily High: 0.8922
    Previous Daily Low: 0.884
    Previous Weekly High: 0.8934
    Previous Weekly Low: 0.8839
    Previous Monthly High: 0.8942
    Previous Monthly Low: 0.8722
    Previous Daily Fibonacci 38.2%: 0.8891
    Previous Daily Fibonacci 61.8%: 0.8871
    Previous Daily Pivot Point S1: 0.886
    Previous Daily Pivot Point S2: 0.8809
    Previous Daily Pivot Point S3: 0.8778
    Previous Daily Pivot Point R1: 0.8942
    Previous Daily Pivot Point R2: 0.8973
    Previous Daily Pivot Point R3: 0.9024

Author

Flavio Tosti

Flavio Tosti

Independent Analyst


More from Flavio Tosti
Share:

Editor's Picks

EUR/USD appears supported by the 200-day SMA, for now

Following an early pullback to multi-week lows near 1.1670, EUR/USD now manages to reclaim the 1.1700 region as the NA session draws to a close on Monday. The steep retracement in spot follows the equally strong move higher in the US Dollar, as investors continue to assess the geopolitical landscape in the wake of the US and Israel attacks on Iran.


GBP/USD hits new yearly lows near 1.3300

GBP/USD adds to the recent bearish tone, approaching to the key 1.3300 support to reach fresh YTD troughs against the backdrop of the robust performance of the US Dollar. Indeed, Cable’s decline comes amid the firm demand for the safe-haven space in the wake of the US and Israel attacks to Iran.

Gold eases some ground, approaches $5,300

Gold now surrenders part of the earlier advance, reshifting its attenton to the $5,300 zone per troy ounce at the beginning of the week. Indeed, the yellow metal’s firm performance appears propped up by incresing geopolitical jitters in the Middle East, which at the same time fuels the demand for the safe-haven space.

Ethereum Price Forecast: BitMine lifts ETH holdings to 4.47M, Lee predicts geopolitical impact on markets

Ethereum (ETH) treasury firm BitMine Immersion (BMNR) bought another 50,928 ETH last week, sending its stash of the top altcoin to 4.47 million ETH worth about $8.9 billion at the time of publication.

The Fed is finally talking about AI – Here's why it matters for the US Dollar

AI is moving from earnings calls into the heart of monetary policy discussions, forcing Federal Reserve officials to confront a new question: How to act if AI reshapes inflation, employment and interest rates at the same time?

Grass 20% bullish breakout defies broader market weakness

Grass (GRASS) is edging up above $0.30 at the time of writing on Monday. The token’s notable 20% intraday surge stands out amid heightened volatility in the broader crypto market.