EUR/GBP Technical Analysis: Euro blasting above 0.8800 figure against Pound

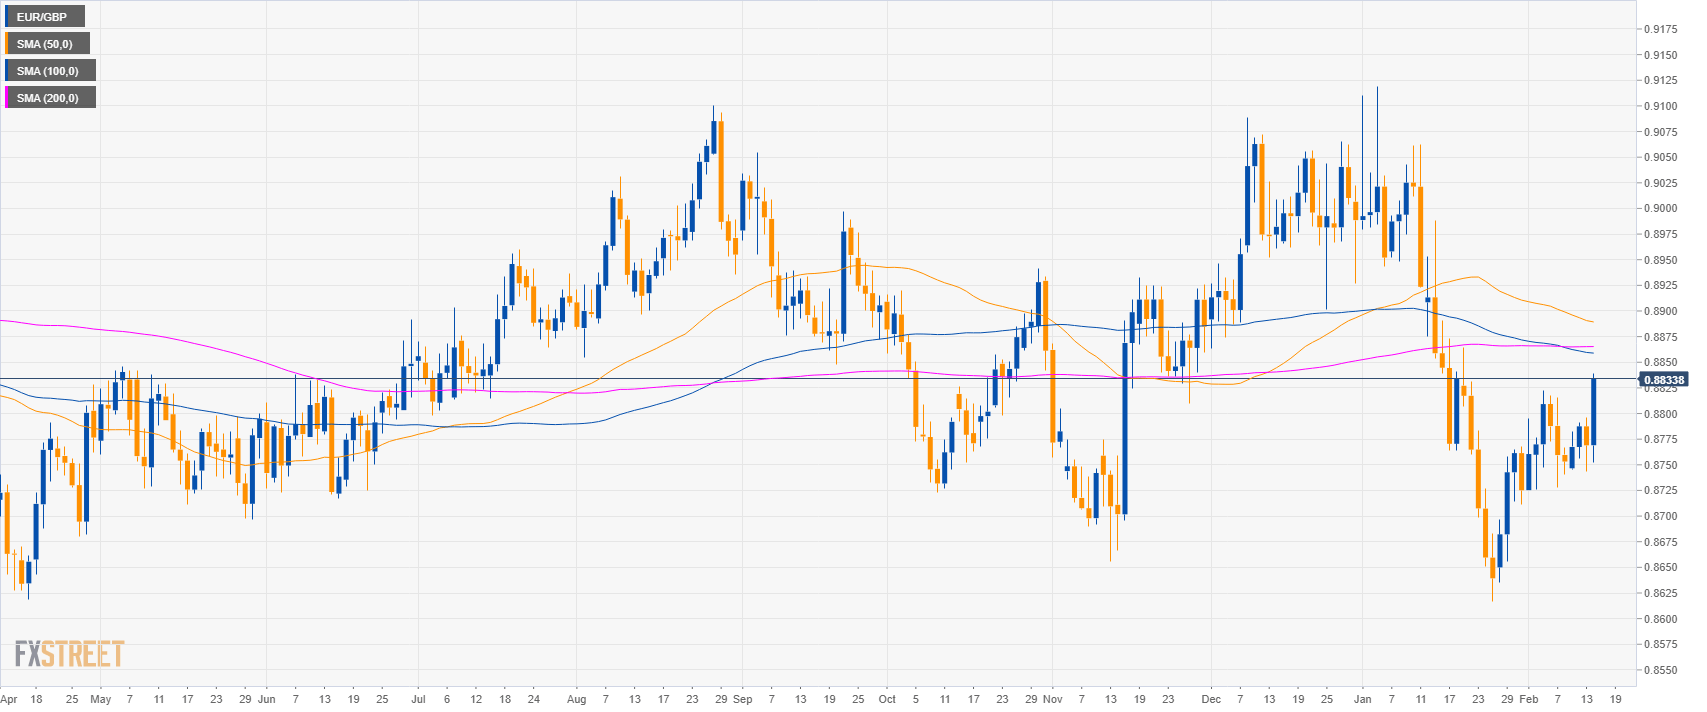
EUR/GBP daily chart
- EUR/GBP is trading in a sideways trend below the 200-day simple moving averages (SMAs).
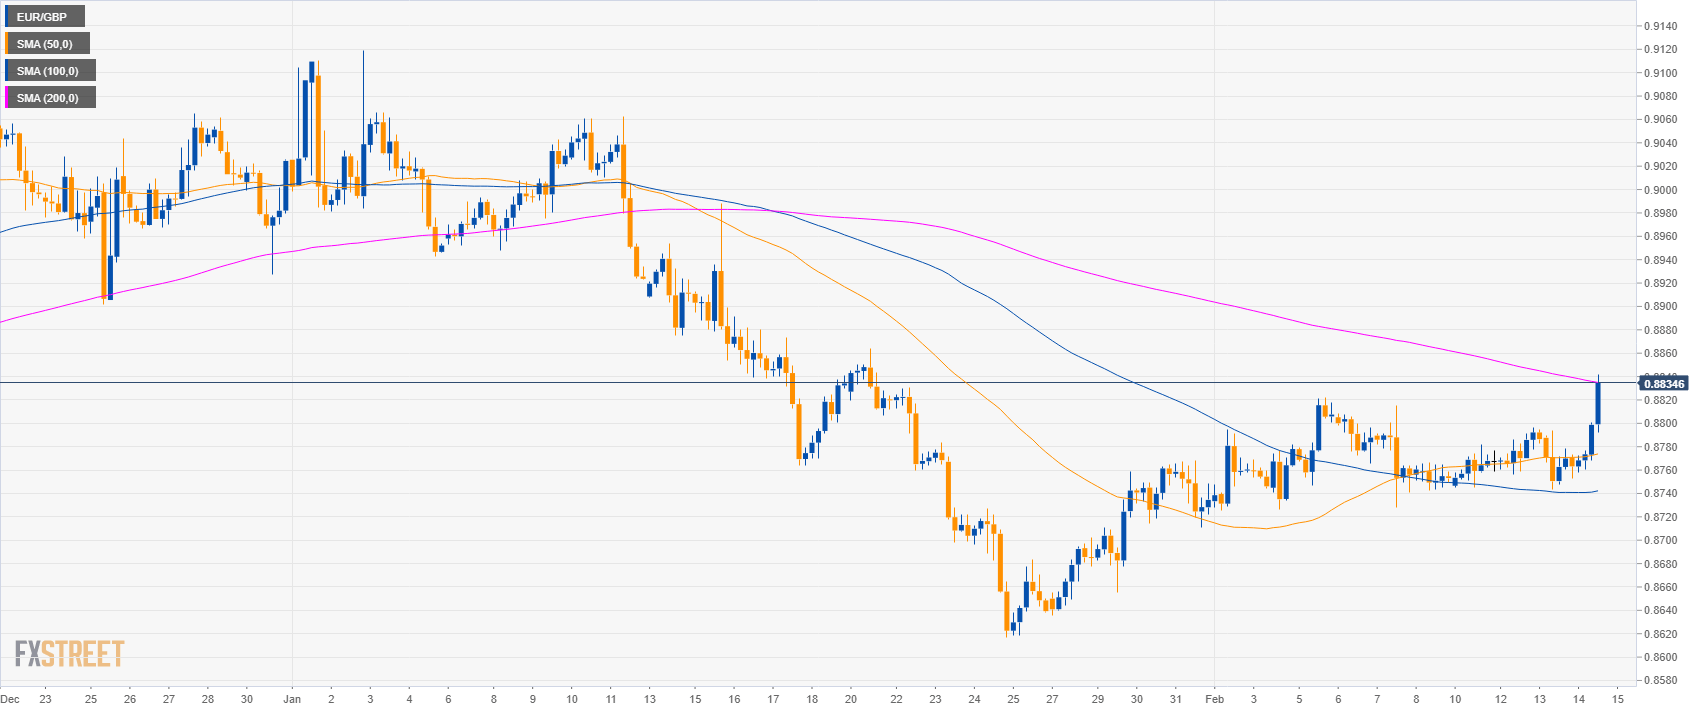
EUR/GBP 4-hour chart
- EUR/GBP is trading between the 100 and 200 SMAs on the 4-hour chart suggesting a sideways market in the medium-term.
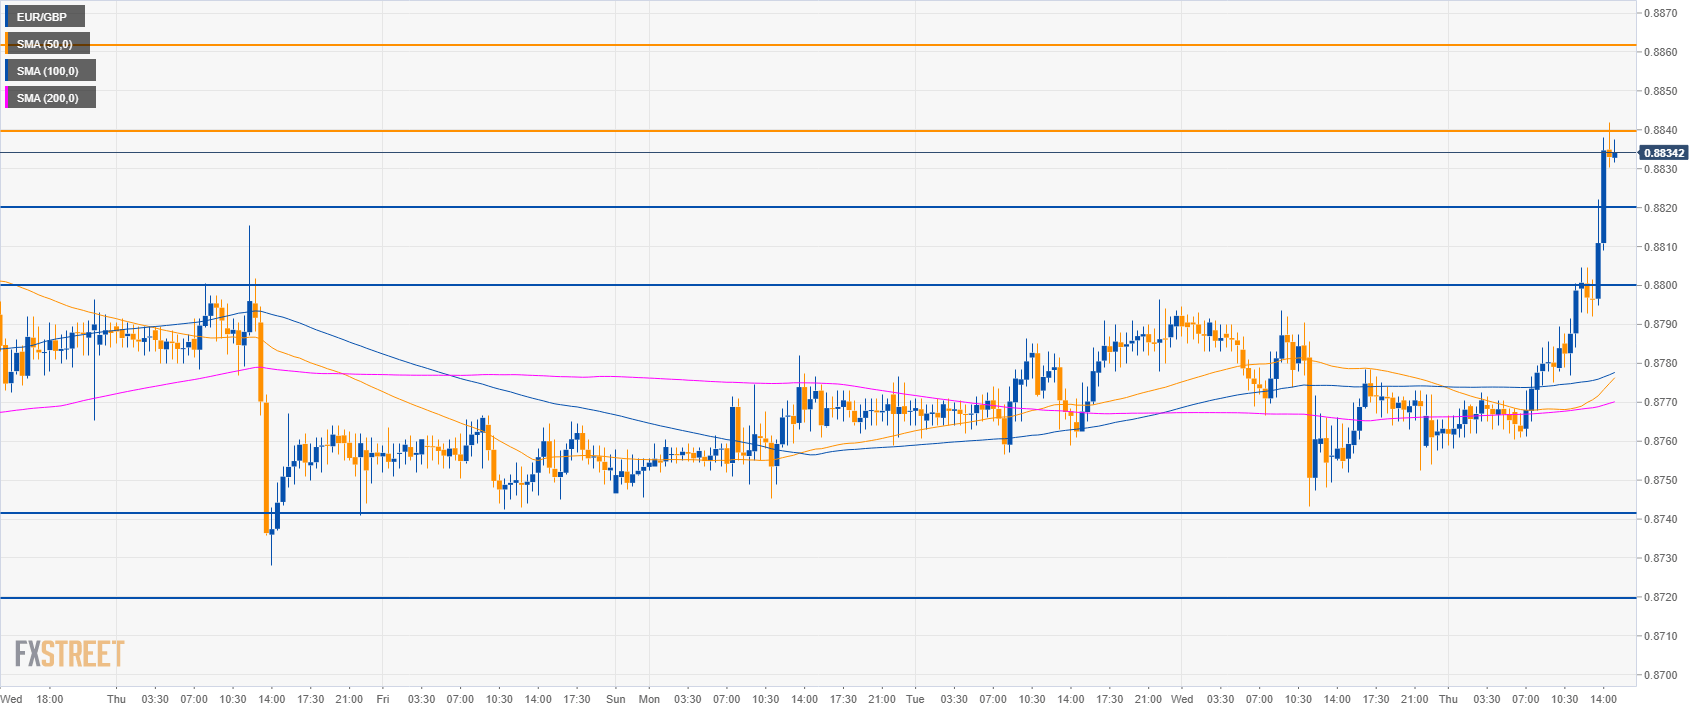
EUR/GBP 30-minute chart
- EUR/GBP is trading above the main SMAs suggesting bullish momentum in the short-term.
- The level to break for bulls is 0.8840. The next level of resistance is seen at 0.8860.
- On the flip side, supports are seen near 0.8820 and 0.8800 figure.
Additional key levels
EUR/GBP
Overview:
Today Last Price: 0.8833
Today Daily change: 64 pips
Today Daily change %: 0.73%
Today Daily Open: 0.8769
Trends:
Daily SMA20: 0.8753
Daily SMA50: 0.8891
Daily SMA100: 0.886
Daily SMA200: 0.8865
Levels:
Previous Daily High: 0.8796
Previous Daily Low: 0.8743
Previous Weekly High: 0.8822
Previous Weekly Low: 0.8726
Previous Monthly High: 0.9119
Previous Monthly Low: 0.8617
Daily Fibonacci 38.2%: 0.8764
Daily Fibonacci 61.8%: 0.8776
Daily Pivot Point S1: 0.8743
Daily Pivot Point S2: 0.8716
Daily Pivot Point S3: 0.8689
Daily Pivot Point R1: 0.8796
Daily Pivot Point R2: 0.8823
Daily Pivot Point R3: 0.8849
Author

Flavio Tosti
Independent Analyst


