EUR/GBP technical analysis: Bearish 4H RSI divergence favors dip below 0.88
- EUR/GBP is looking heavy, courtesy of the bearish RSI divergence on the 4-hour chart.
- The daily RSI is flashing overbought signal.

EUR/GBP is currently trading at 0.8820 and risks printing session lows below 0.88 today, as key indicator has diverged in favor of the bears.
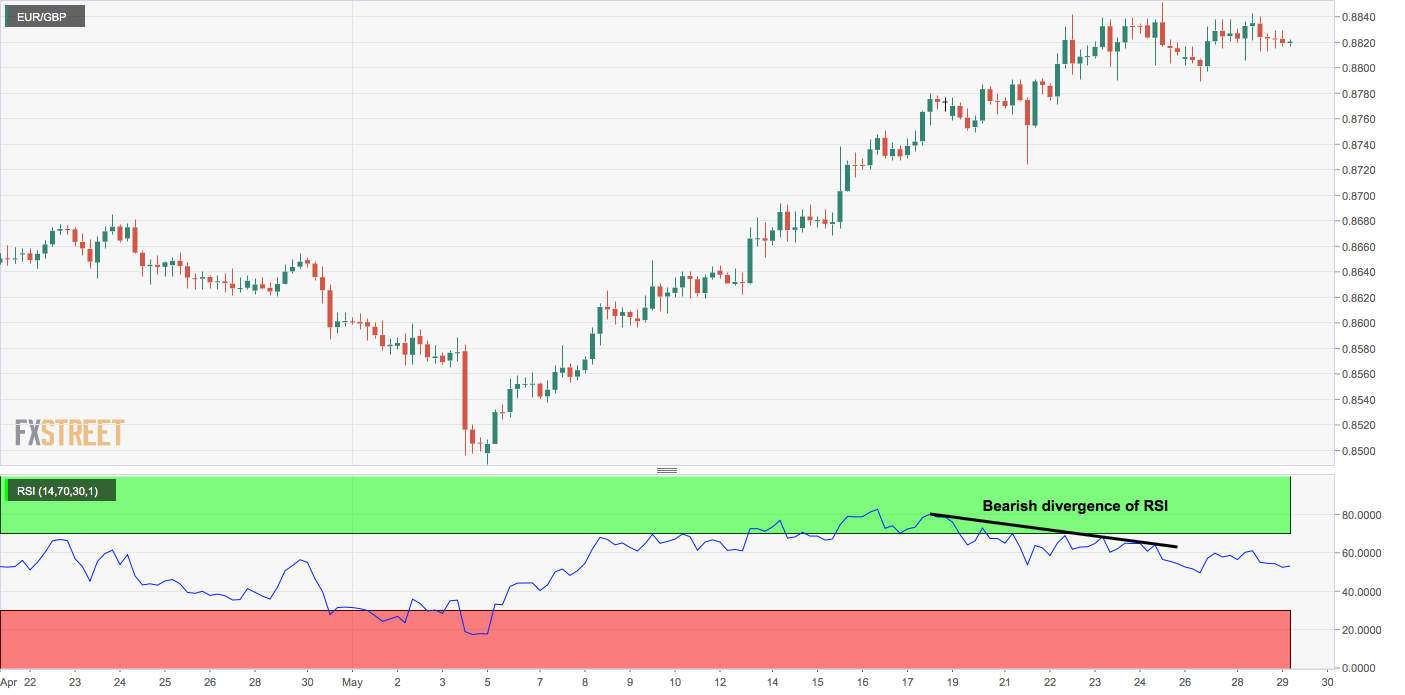
The relative strength index (RSI) one the 4-hour chart is now threatening to drop below 50.00 (bearish territory), having confirmed a bearish divergence on May 23. A bearish divergence occurs when the indicator charts lower highs as opposed to higher highs on price.
The case for pullback below 0.88 looks stronger if we take into account the overbought readings on the 14-day relative strength index (RSI) and the indecision represented by the spinning top-like candle created on Tuesday.
It is worth noting that the ascending 10-day moving average is currently located at 0.8797. As a result, dips below that average could be short-lived.
4-hour chart
Trend: Bearish
Pivot levels
Author

Omkar Godbole
FXStreet Contributor
Omkar Godbole, editor and analyst, joined FXStreet after four years as a research analyst at several Indian brokerage companies.


