EUR/GBP Price Forecast: The first upside barrier emerges around 0.8450, Eurozone GDP data in focus
- EUR/GBP strengthens 0.8435 in Friday’s Asian session.
- The cross keeps the bearish vibe below the 100-period EMA, but RSI indicator shows further upside cannot be ruled out.
- The immediate resistance level emerges at 0.8440; 0.8417 acts as an initial support level.

The EUR/GBP cross trades in positive territory for the third consecutive day around 0.8435 during the Asian session on Friday. The Eurozone Gross Domestic Product (GDP) for the second quarter (Q2) will be closely watched, which is estimated to grow 0.3% QoQ and 0.6% YoY in the second quarter (Q2).
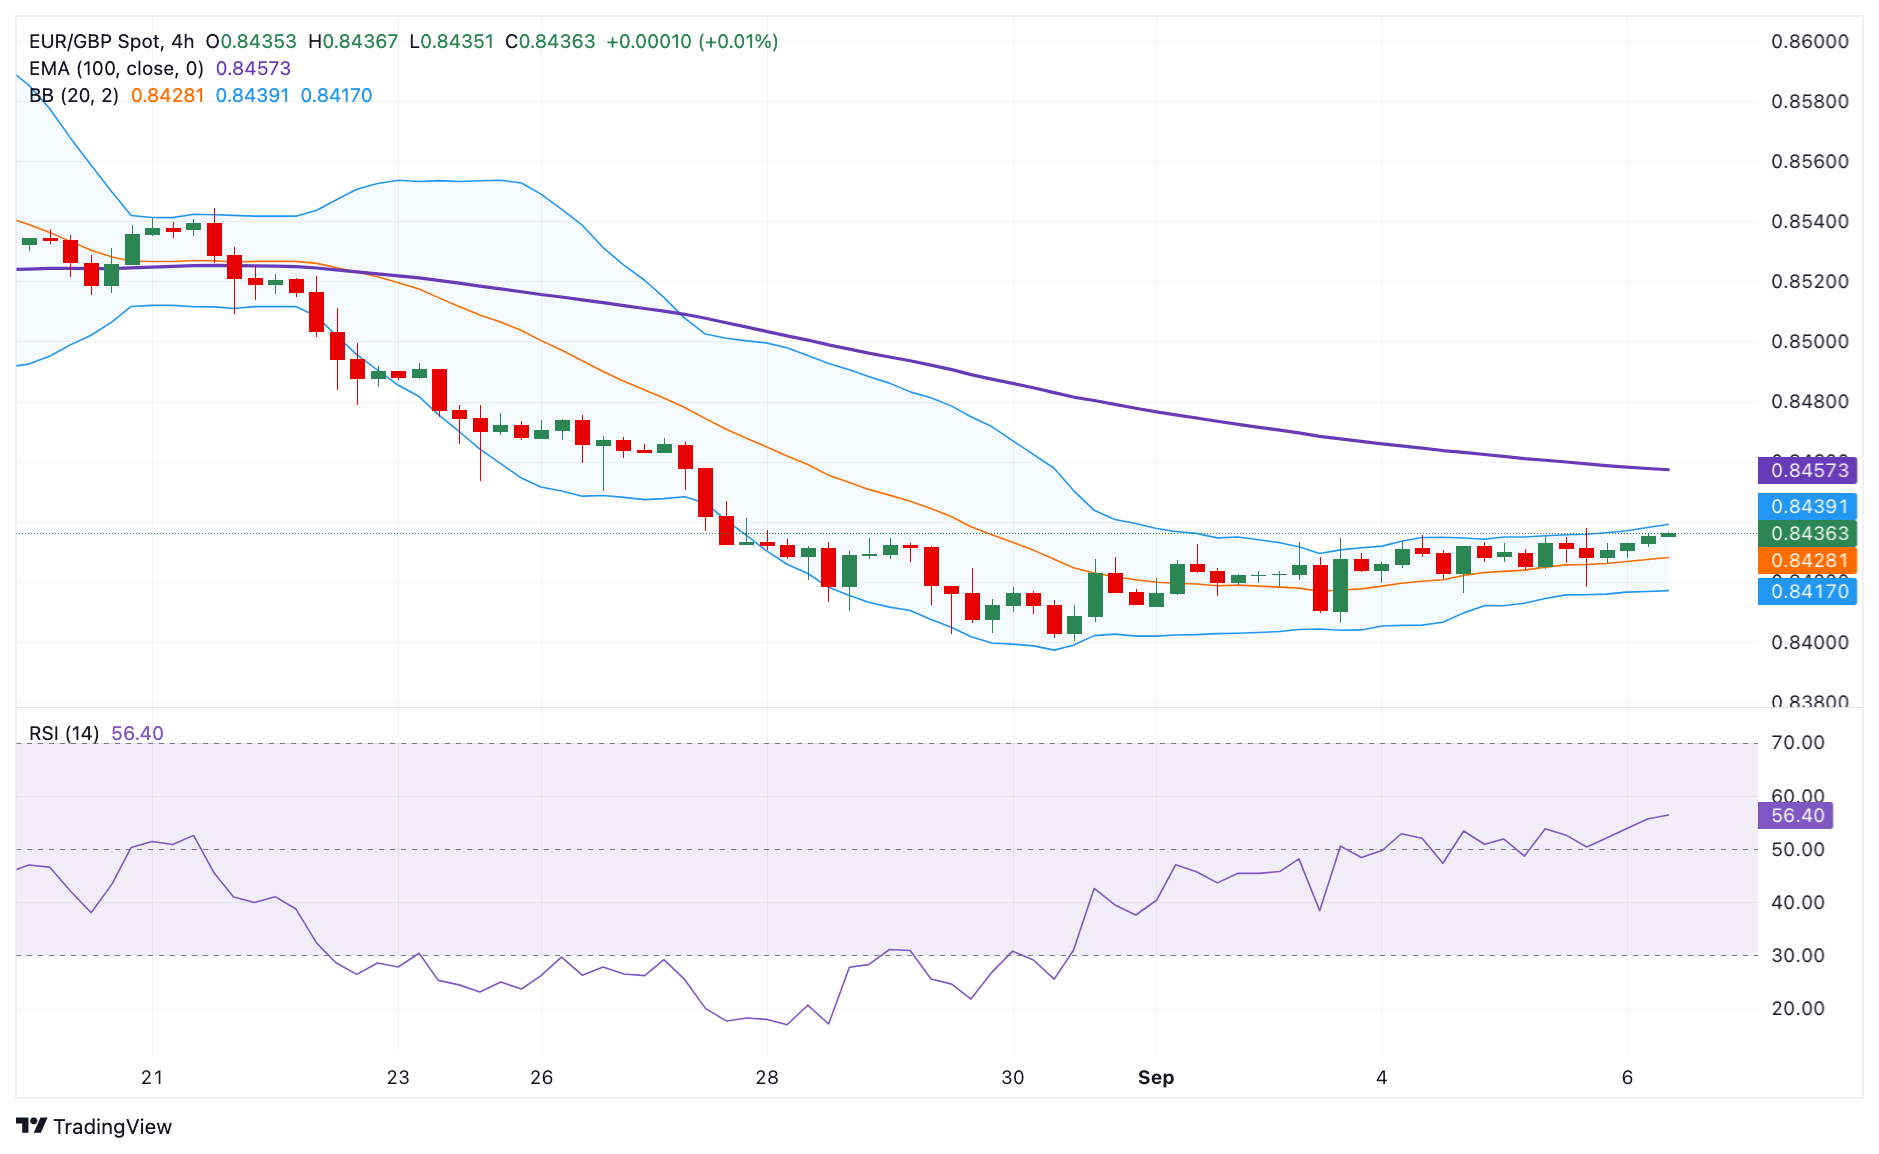
According to the 4-hour chart, the negative outlook of EUR/GBP remains intact as the cross holds below the key 100-period Exponential Moving Averages (EMA). However, the further upside cannot be ruled out as the Relative Strength Index (RSI) points higher above the midline near 56.0.
The first upside barrier for EUR/GBP emerges at 0.8440, the upper boundary of the Bollinger Band. Further north, the next hurdle is seen at 0.8457. A decisive break above this level will see a rally to the 0.8500 psychological level.
On the flip side, the initial support level is located at 0.8417, the lower limit of the Bollinger Band. The potential contention level to watch is the 0.8400-0.8405 region, representing the round figure and the low of September 3. The additional downside filter to watch is 0.8383, the low of July 17.
EUR/GBP 4-hour chart
(This story was corrected on September 6 at 06:59 GMT to say, in the title, that the first barrier emerges at around 0.8450, not 0.8550.)
GDP FAQs
A country’s Gross Domestic Product (GDP) measures the rate of growth of its economy over a given period of time, usually a quarter. The most reliable figures are those that compare GDP to the previous quarter e.g Q2 of 2023 vs Q1 of 2023, or to the same period in the previous year, e.g Q2 of 2023 vs Q2 of 2022. Annualized quarterly GDP figures extrapolate the growth rate of the quarter as if it were constant for the rest of the year. These can be misleading, however, if temporary shocks impact growth in one quarter but are unlikely to last all year – such as happened in the first quarter of 2020 at the outbreak of the covid pandemic, when growth plummeted.
A higher GDP result is generally positive for a nation’s currency as it reflects a growing economy, which is more likely to produce goods and services that can be exported, as well as attracting higher foreign investment. By the same token, when GDP falls it is usually negative for the currency. When an economy grows people tend to spend more, which leads to inflation. The country’s central bank then has to put up interest rates to combat the inflation with the side effect of attracting more capital inflows from global investors, thus helping the local currency appreciate.
When an economy grows and GDP is rising, people tend to spend more which leads to inflation. The country’s central bank then has to put up interest rates to combat the inflation. Higher interest rates are negative for Gold because they increase the opportunity-cost of holding Gold versus placing the money in a cash deposit account. Therefore, a higher GDP growth rate is usually a bearish factor for Gold price.
Author

Lallalit Srijandorn
FXStreet
Lallalit Srijandorn is a Parisian at heart. She has lived in France since 2019 and now becomes a digital entrepreneur based in Paris and Bangkok.