|

EUR/GBP Price Forecast: Falls back down to floor of range

  • EUR/GBP has sold-off back down to the lows of its short-term range. 
  • It is probably in a sideways trend and is likely to encounter stubborn support at the range lows. 

EUR/GBP declines all the way back down to the base of its six-week range (red dashed line on chart) at roughly 0.8311; it is likely to encounter firm support at the level.

EUR/GBP 4-hour Chart 

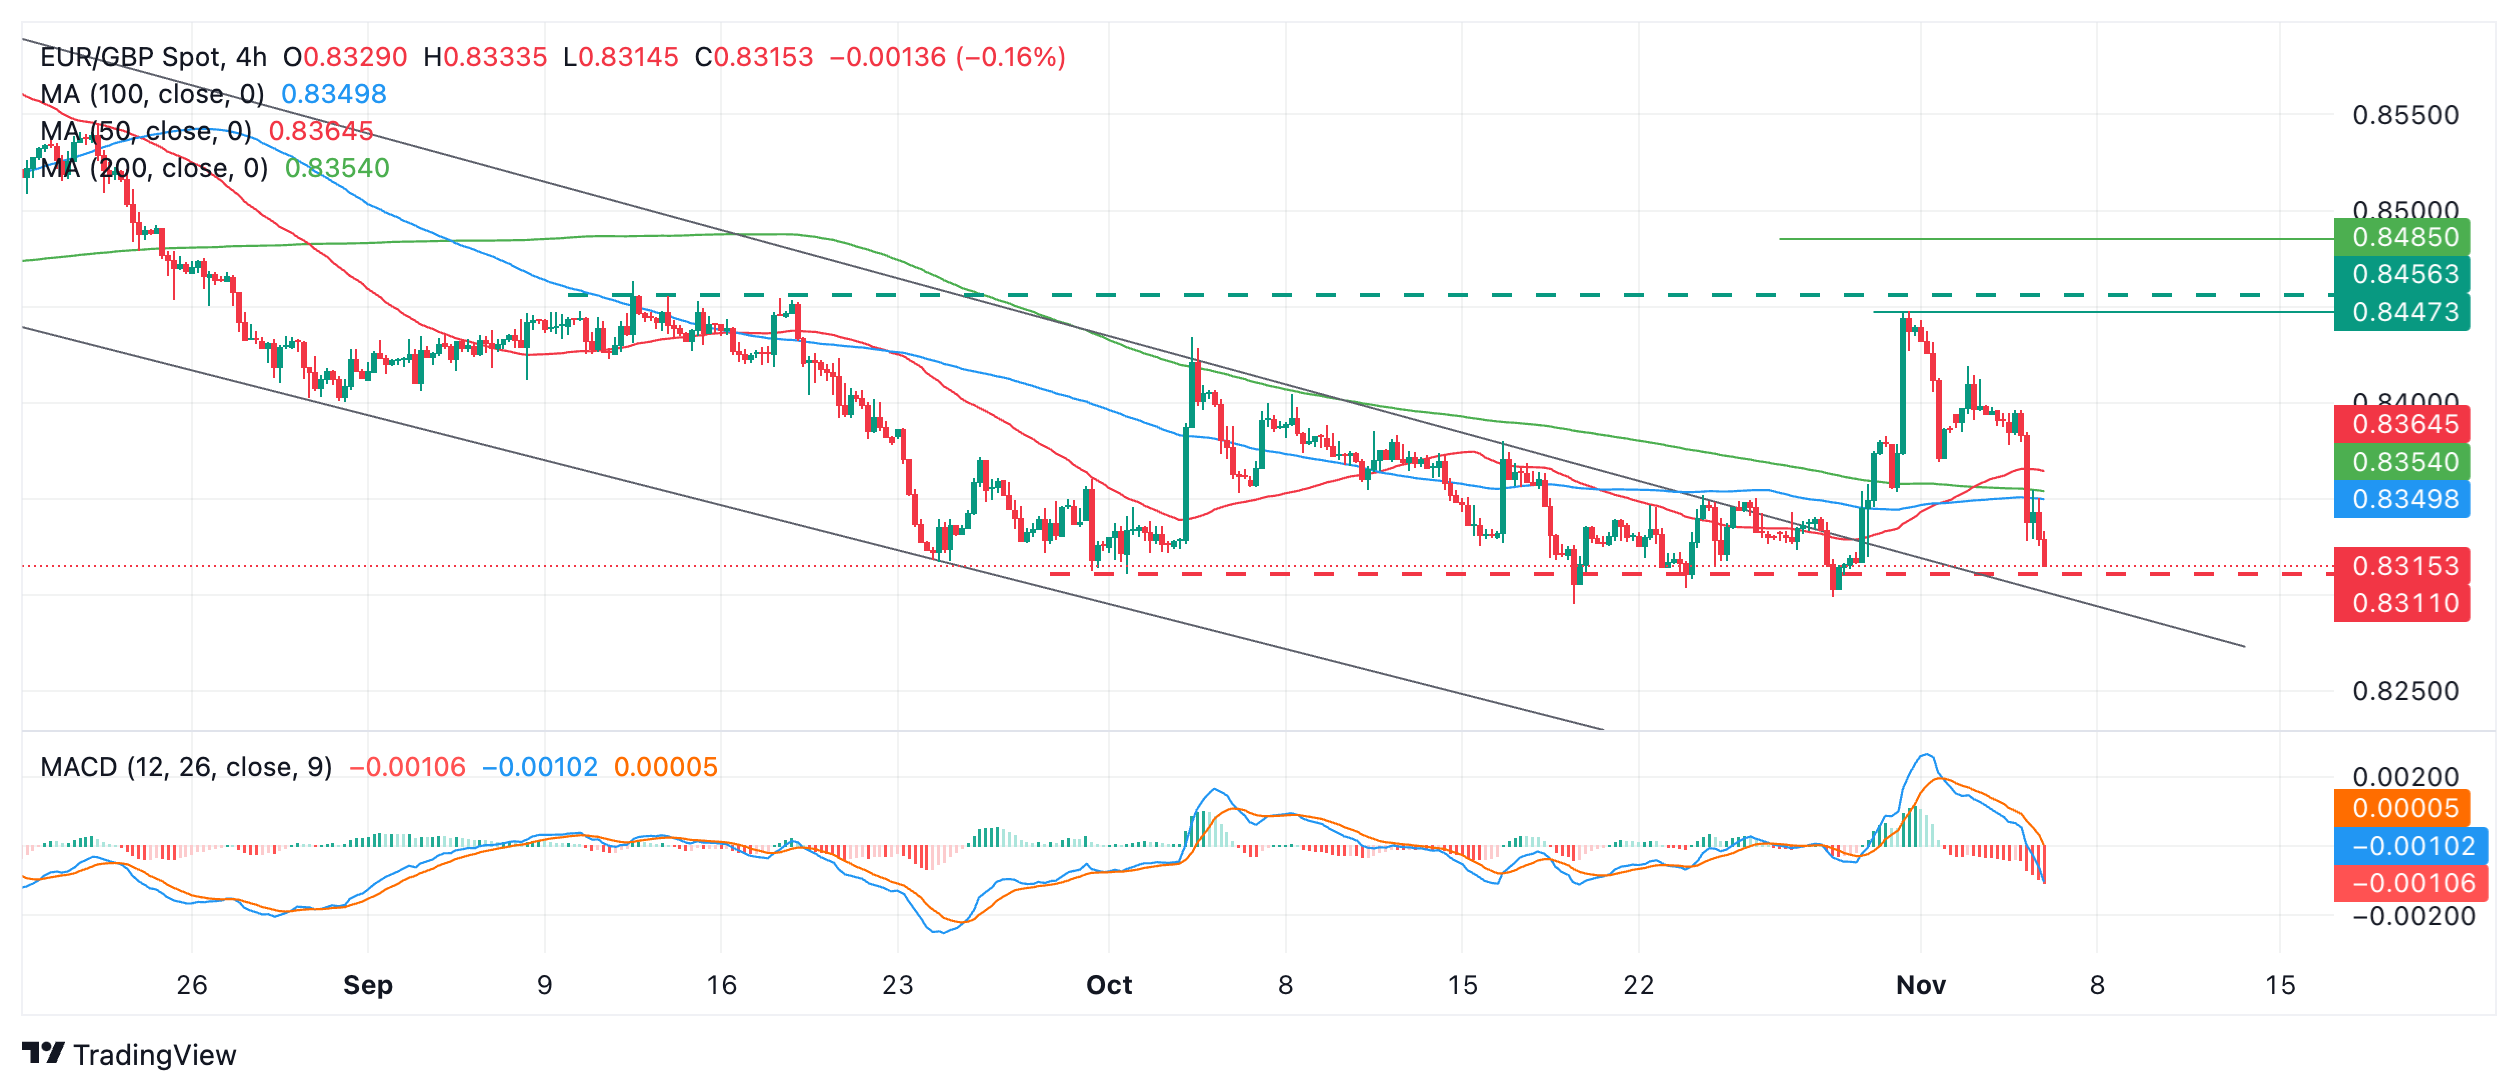
The pair is probably in a short-term sideways trend and given the technical analysis principle that “the trend is your friend” the odds favor an extension of this range-bound price action. 

Therefore, if EUR/GBP stops selling off at the range floor and starts to bounce higher it would confirm that the sideways trend was extending. That said, price has not slowed its descent yet, is still pushing lower and showing no signs of a bounce. 

If the bearish behavior continues and EUR/GBP breaks decisively below the 0.8311 floor, it would suggest the medium and long-term downtrends were reasserting themselves, and the pair was likely to fall further. However, it should be noted these levels represent over two-year lows for the pair.

Nevertheless, a clean break below them, by a longer-than-average daily candlestick below the 0.8311 lows, or perhaps by three consecutive red candles, would confirm a decisive breakdown. Such a move would probably then lead to a sell-off to around the 0.8240 level, this being the 61.8% Fibonacci extension of the height of the range extrapolated lower. 

Author

Joaquin Monfort

Joaquin Monfort is a financial writer and analyst with over 10 years experience writing about financial markets and alt data. He holds a degree in Anthropology from London University and a Diploma in Technical analysis.

More from Joaquin Monfort
Share:

Editor's Picks

AUD/USD eyes 0.7150 barrier nine-day EMA

AUD/USD inches higher after registering modest losses in the previous day, trading around 0.7130 during the Asian hours. The technical analysis of the daily chart indicates that the pair is moving sideways within the rectangle pattern, suggesting a consolidation as neither the bulls nor the bears have enough momentum to take control of the market.

USD/JPY trades below 160.00 intervention threshold; bullish bias intact

The USD/JPY pair attracts some sellers during the Asian session amid fears that authorities will step in again to prop up the Japanese Yen. Furthermore, the Israel-Lebanon truce prompts some profit-taking around the US Dollar and exerts downward pressure on the currency pair.

Gold meets contention near $4,420…for now

Gold extends its recovery past the $4,500 mark per troy ounce on Thursday. The yellow metal’s advance comes amid the resurgence of some selling interest around the, improving risk sentiment, and declining US Treasury yields across the curve.

Bitcoin’s massive storm is back: Why the sell-off is far from over

Bitcoin price action over the last few weeks has felt less like a normal, healthy correction and more like a slow grinding crash that continues to wreak havoc on holdings and trading accounts. And everything suggests that the dramatic crash isn’t over.

Nonfarm payrolls: Testing the limits of Fed policy patience

The upcoming nonfarm payrolls report for May will provide the final update on the US labor market before Kevin Warsh attends his first policy meeting as the new Fed Chair later this month.

Recession on paper: What really moves the Canadian Loonie now?

Statistics Canada handed the headline writers a gift and the analysts a headache. Real GDP shrank 0.1% on an annualized basis in the first quarter, and with the fourth quarter of 2025 revised down to a 1.0% contraction, that is two negative quarters in a row, the textbook definition of a technical recession and Canada's first since the pandemic.