|

EUR/GBP Price Analysis: Slips below 0.8600 on tweezers-top and inverted hammer

  • EUR/GBP trades at 0.8595, down 0.12%, as traders position for a possible ECB rate hike of 25 basis points.
  • Daily chart shows a tweezers-top inverted hammer, indicating potential for further losses; key support at 50-day MA of 0.8580.
  • One-hour chart suggests next support at 0.8587; resistance levels emerge at 50-HMA of 0.8598 and 0.8600 figure.

The Euro (EUR) loses territory against the Pound Sterling (GBP), as traders brace for tomorrow’s European Central Bank (ECB) monetary policy decision. Despite odds the ECB would raise rates by 25 basis points, it was no excuse for EUR/GBP traders to short the pair ahead of the meeting. The cross-currency pair exchanges hands at 0.8595, down 0.12%.

EUR/GBP Price Analysis: Technical outlook

The daily chart portrays the pair reaching a four-week high at 0.8630 but erased those gains and formed a tweezers-top inverted hammer, which could pave the way for further losses. But a daily close at around 0.8592 is needed to cement a downward correction. In that case, the cross-currency next support would be the 50-day Moving Average (DMA) at 0.8580, followed by the September 12 swing low of 0.8569. Upside risks emerge at the current week’s high of 0.8630.

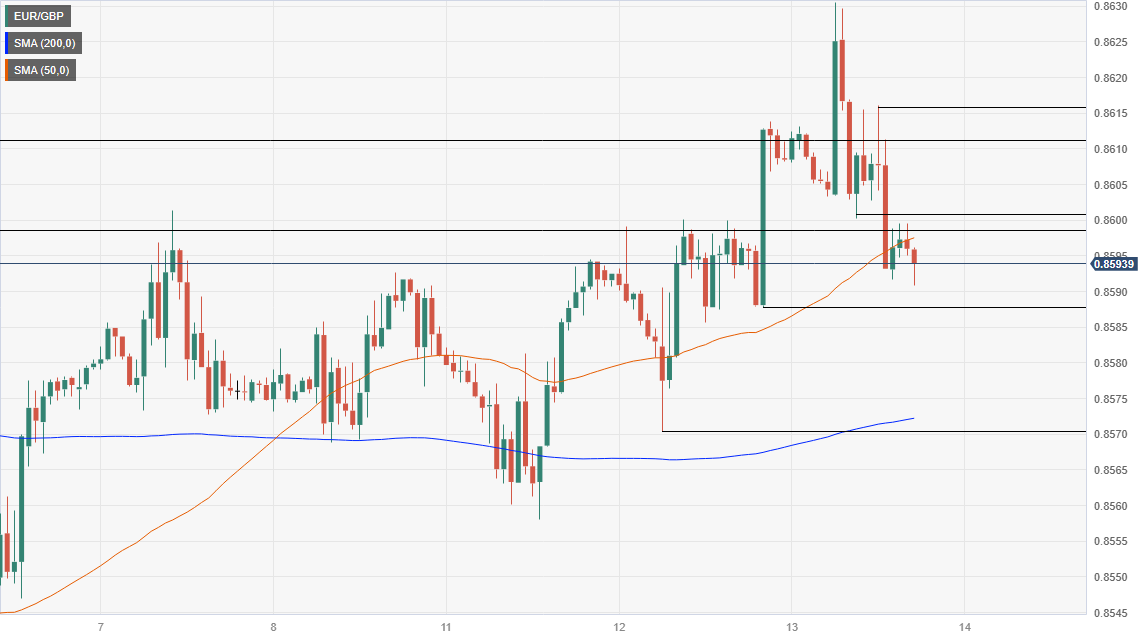
The one-hour chart portrays the pair failed to extend its gains past the daily high and retreated below the previous higher-low of 0.8603, opening the door for further downside. The next support would be 0.8587, followed by the 200-hour Moving Average (HMA) at 0.8572. On the flip side, the EUR/GBP first resistance would be the 50-HMA at 0.8598, the 0.8600 figure, and the next swing high at 0.8616.

EUR/GBP Price Action – Daily chart

EUR/GBP

EUR/GBP

Overview
Today last price0.8592
Today Daily Change-0.0021
Today Daily Change %-0.24
Today daily open0.8613
 
Trends
Daily SMA200.8564
Daily SMA500.8582
Daily SMA1000.8617
Daily SMA2000.8712
 
Levels
Previous Daily High0.8613
Previous Daily Low0.857
Previous Weekly High0.8601
Previous Weekly Low0.8524
Previous Monthly High0.8669
Previous Monthly Low0.8493
Daily Fibonacci 38.2%0.8597
Daily Fibonacci 61.8%0.8587
Daily Pivot Point S10.8584
Daily Pivot Point S20.8556
Daily Pivot Point S30.8542
Daily Pivot Point R10.8627
Daily Pivot Point R20.8641
Daily Pivot Point R30.8669
 

Author

Christian Borjon Valencia

Markets analyst, news editor, and trading instructor with over 14 years of experience across FX, commodities, US equity indices, and global macro markets.

More from Christian Borjon Valencia
Share:

Editor's Picks

EUR/USD eyes nine-day EMA barrier after rebounding from 1.1600

EUR/USD gains ground after registering modest losses in the previous session, trading around 1.1620 during the Asian hours on Friday. The technical analysis of the daily chart suggests an ongoing bearish bias as the pair remains within the descending channel pattern.

GBP/USD: Pound Sterling ticks up against US Dollar in countdown to US NFP

The Pound Sterling trades marginally higher to near 1.3365 against the US Dollar during the Asian trading session on Friday. The GBP/USD pair edges up as the US Dollar ticks down ahead of the United States Nonfarm Payrolls data for February, which will be published at 13:30 GMT.

Gold rises but remains on track for weekly loss in five weeks

Gold price recovers its recent losses from the previous session on Friday. The yellow metal advances as the broader precious metals market rebounds on safe-haven demand. However, the yellow metal is on track for its first weekly decline in five weeks as escalating Middle East tensions push oil prices higher, fueling inflation concerns and reducing bets on Federal Reserve rate cuts.

Bitcoin, Ethereum and Ripple at risk as US-Iran war extends

Bitcoin, Ethereum, and Ripple trade cautiously at press time on Friday, close to key support levels after a roughly 2% pullback the previous day. Bitcoin holds above $71,000, Ethereum at $2,000, and XRP continues to consolidate in a sideways range.

The market compass is pointing at a barrel of Oil

The Asian open is arriving with equities leaning the wrong way, and the reason is not complicated. The market’s compass needle has snapped firmly toward crude. In this tape, oil is not just another input price; it is the gravitational center around which every asset class is orbiting.

Top 3 Price Prediction: Bitcoin, Ethereum, Ripple at risk as US-Iran war extends

Bitcoin, Ethereum, and Ripple trade cautiously at press time on Friday, close to key support levels after a roughly 2% pullback the previous day. Bitcoin holds above $71,000, Ethereum at $2,000, and XRP continues to consolidate in a sideways range.