|

EUR/GBP Price Analysis: Sellers hit the gas and take further ground

  • EUR/GBP weakens further, and buying pressure continues to retreat.
  • The RSI is moving dangerously near the oversold threshold.
  • The 0.8380 presents a strong barrier against the sellers.

In Friday's session, the EUR/GBP pair continued to decline, losing 0.15% to close at 0.8385. The bearish outlook persists, as selling pressure intensifies and technical indicators signal a negative trend.

Looking at the technical outlook, the Relative Strength Index (RSI) has fallen to 35, moving deeper into the negative area. This sharp decline indicates that selling pressure is rising. Furthermore, the Moving Average Convergence Divergence (MACD) histogram remains red and rising, also suggesting increasing bearish momentum. 

EUR/GBP daily chart

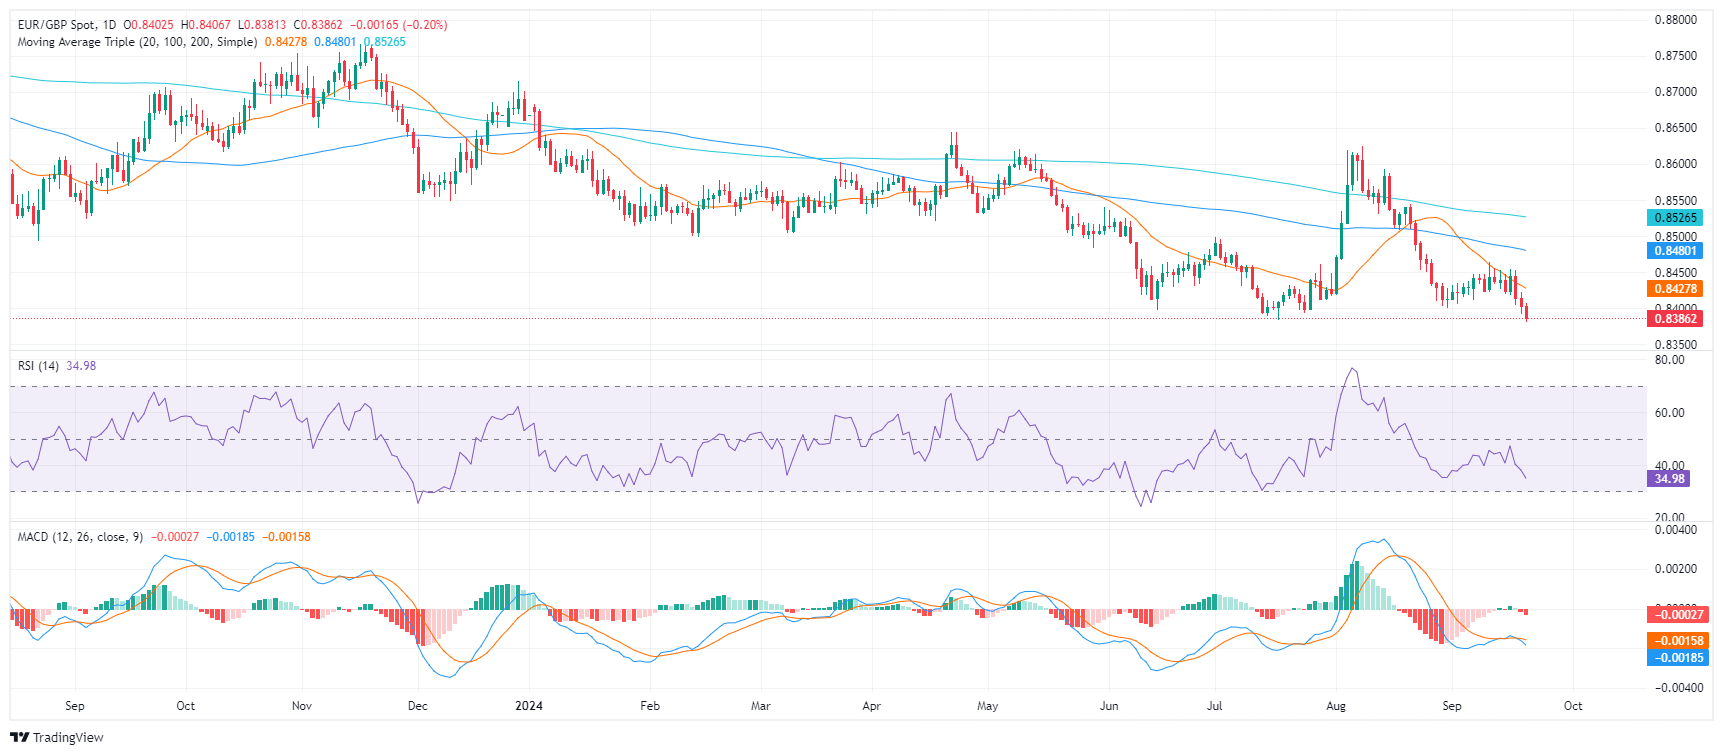
Based on the current technical picture, the EUR/GBP pair is likely to continue its downward trajectory. Support levels can be found at 0.8380, 0.8350, and 0.8330. If the pair breaks below 0.8380, it could signal a deeper decline toward 0.8350. Resistance levels can be found at 0.8420 (20-day Simple Moving Average (SMA)), 0.8430, and 0.8440. A break above 0.8440 could indicate a potential trend reversal.

Overall, the technical indicators and recent price action suggest that the bearish momentum is likely to continue in the short term. As bears point their cannons towards 0.8380, a break below would mark a fresh yearly low, which would confirm a bearish outlook.

Author

Patricio Martín

Patricio is an economist from Argentina passionate about global finance and understanding the daily movements of the markets.

More from Patricio Martín
Share:

Markets move fast. We move first.

Orange Juice Newsletter brings you expert driven insights - not headlines. Every day on your inbox.

By subscribing you agree to our Terms and conditions.

Editor's Picks

EUR/USD bounces toward 1.1750 as US Dollar loses strength

EUR/USD returned to the 1.1750 price zone in the American session on Friday, despite falling Wall Street, which indicates risk aversion. Trading conditions remain thin following the New Year holiday and ahead of the weekend, with the focus shifting to US employment and European data scheduled for next week.

GBP/USD nears 1.3500, holds within familiar levels

After testing 1.3400 on the last day of 2025, GBP/USD managed to stage a rebound. Nevertheless, the pair finds it difficult to gather momentum and trades with modest intraday gains at around 1.3490 as market participants remain in holiday mood.

Gold trims intraday gains, approaches $4,300

Gold retreated sharply from the $4,400  area and trades flat for the day in the $4,320 price zone. Choppy trading conditions exacerbated the intraday decline, although XAU/USD bearish case is out of the picture, considering growing expectations for a dovish Fed and persistent geopolitical tensions.

Cardano gains early New Year momentum, bulls target falling wedge breakout

Cardano kicks off the New Year on a positive note and is extending gains, trading above $0.36 at the time of writing on Friday. Improving on-chain and derivatives data point to growing bullish interest, while the technical outlook keeps an upside breakout in focus.

Economic outlook 2026-2027 in advanced countries: Solidity test

After a year marked by global economic resilience and ending on a note of optimism, 2026 looks promising and could be a year of solid economic performance. In our baseline scenario, we expect most of the supportive factors at work in 2025 to continue to play a role in 2026.

Crypto market outlook for 2026

Year 2025 was volatile, as crypto often is.  Among positive catalysts were favourable regulatory changes in the U.S., rise of Digital Asset Treasuries (DAT), adoption of AI and tokenization of Real-World-Assets (RWA).