|

EUR/GBP Price Analysis: Sell-off pauses and consolidates

  • EUR/GBP has slowed its decline and is consolidating after forming a temporary bottom. 
  • The trend remains bearish, however, there are signs the bear trend may be exhausted and about to reverse. 

EUR/GBP has paused its sell-off within a falling channel. The pair temporarily broke below the bottom of the channel (shaded circle) before recovering and consolidating. This break may be a sign of exhaustion and the first faint signs of a reversal higher, however, it is too soon to tell. 

EUR/GBP 4-hour Chart 

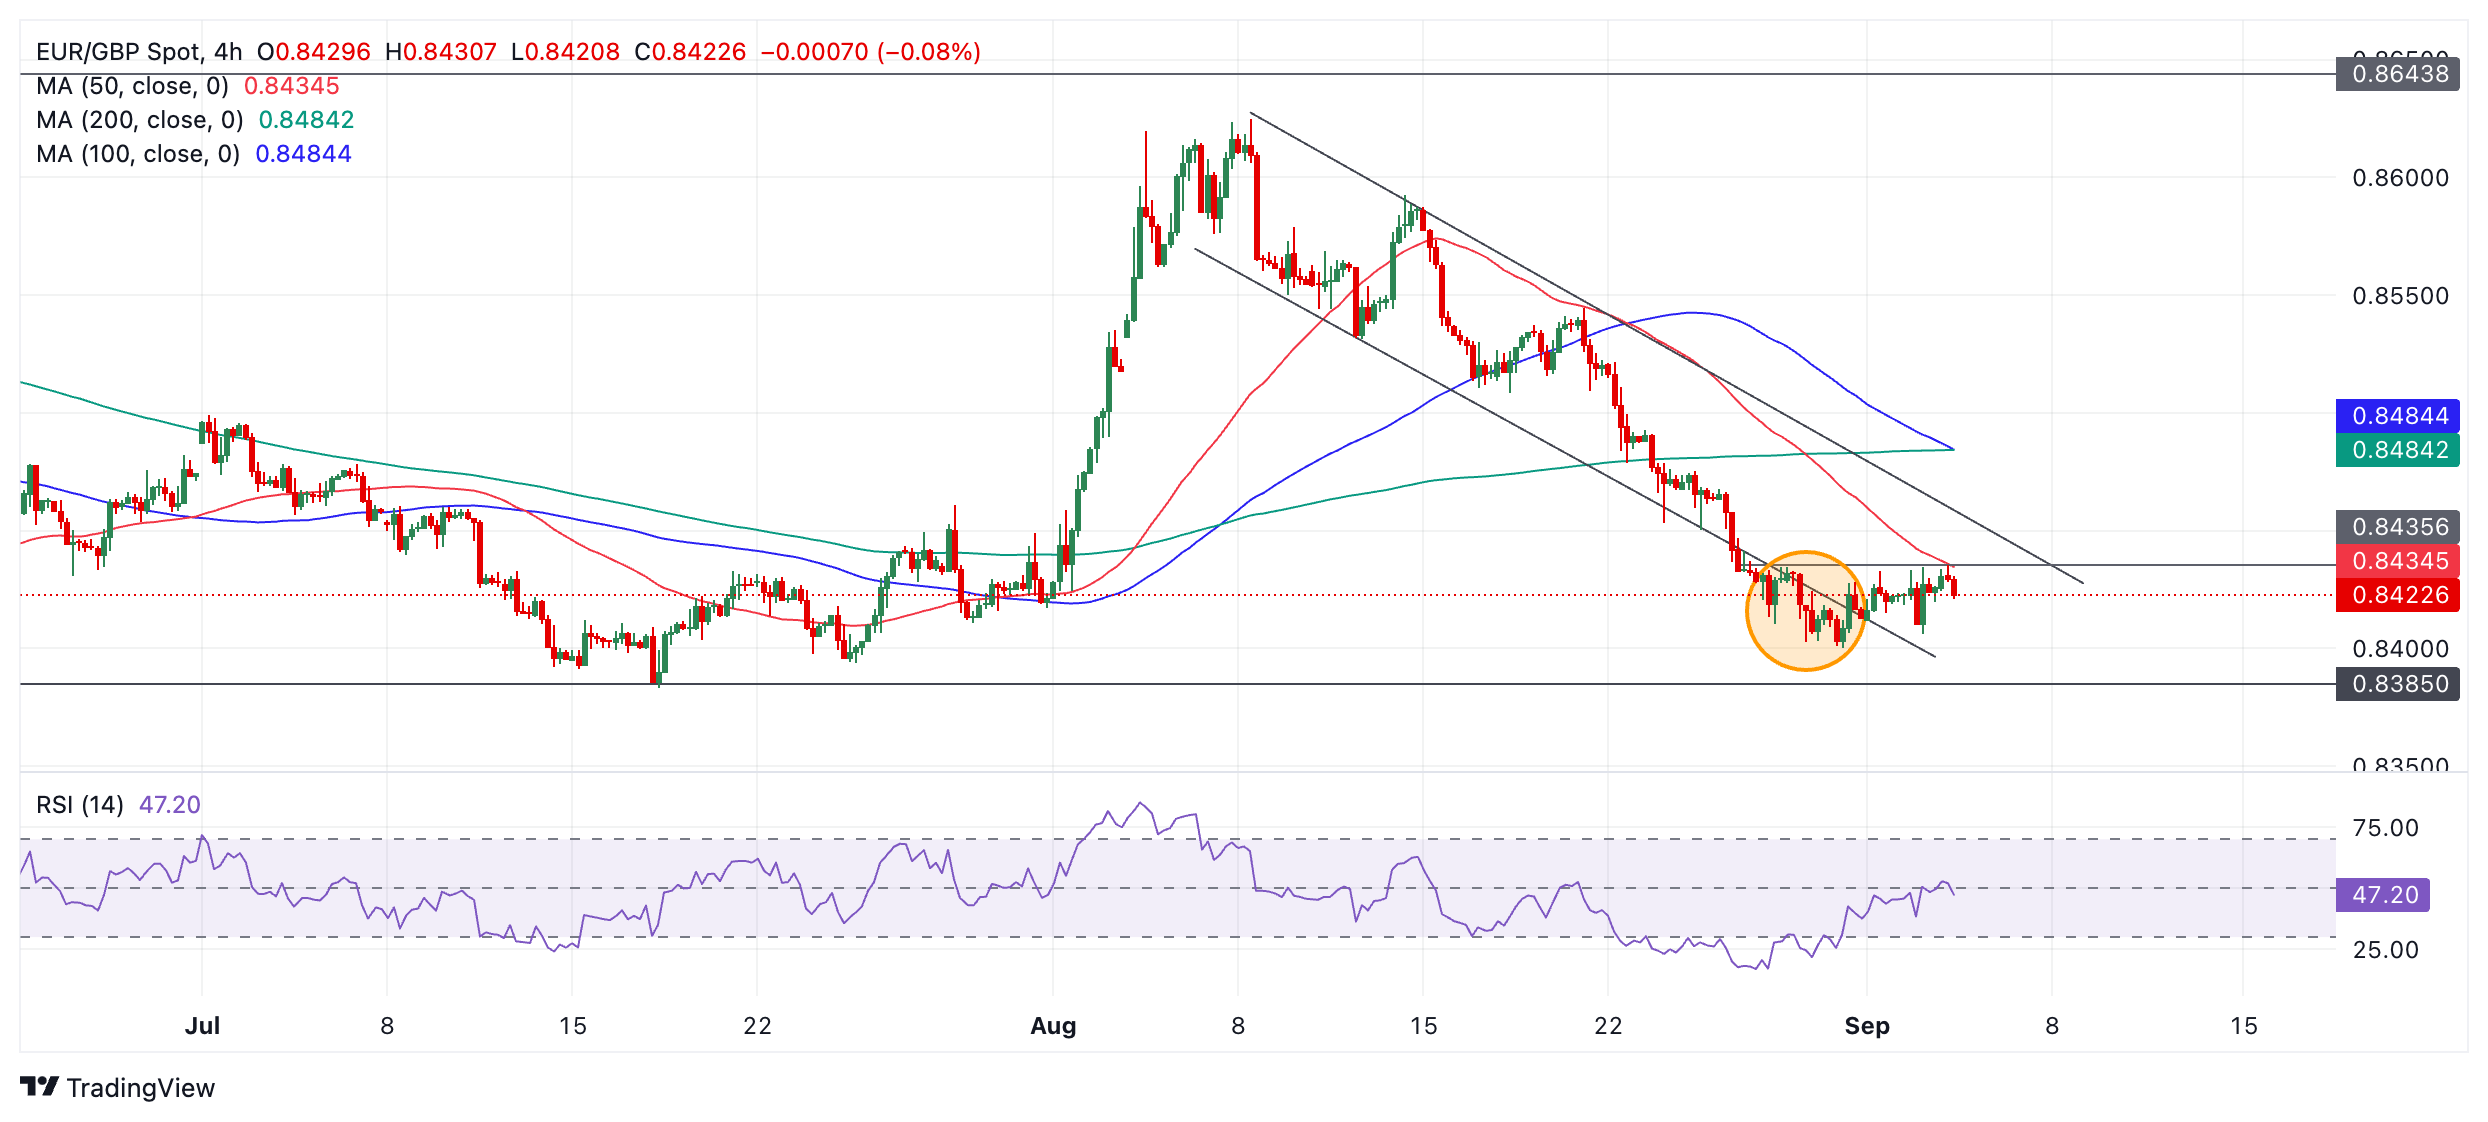
So far, the recovery has been quite shallow and it is currently capped by resistance from the 50-period Simple Moving Average (SMA). Price would need to break decisively above the SMA and the line of highs at 0.8435 to provide a stronger bullish signal. Such a move would be expected to extend to the upper channel line at roughly 0.8450 where it would probably encounter reasonably tough resistance. A decisive break would be accompanied by a long green candle that closed near its high or three green candles in a row. 

The short-term trend remains bearish, however, suggesting the odds continue to favor an extension lower. A break below 0.8406 (September 3 low) would pave the way for further weakness to a downside target at 0.8385 (July 17 lows). 

The long-term trend (weekly chart) is still bearish whilst the medium-term trend is bullish

Author

Joaquin Monfort

Joaquin Monfort is a financial writer and analyst with over 10 years experience writing about financial markets and alt data. He holds a degree in Anthropology from London University and a Diploma in Technical analysis.

More from Joaquin Monfort
Share:

Markets move fast. We move first.

Orange Juice Newsletter brings you expert driven insights - not headlines. Every day on your inbox.

By subscribing you agree to our Terms and conditions.

Editor's Picks

EUR/USD eyes 1.1800 barrier near two-month highs

EUR/USD extends its gains for the second consecutive day on Tuesday and approaches 1.1800. On the daily chart, technical analysis indicates a persistent bullish bias, as the pair moves upward within the ascending channel pattern. Additionally, the 14-day Relative Strength Index at 68.89 reaffirms the bullish bias.

GBP/USD climbs to 1.3500 area, renews ten-week high

GBP/USD extends its weekly rally and trades at its highest level since early October near 1.3500. The US Dollar remains under persistent bearish pressure heading into the holidays, while Pound traders largely brush off the latest interest rate cut from the Bank of England.

Gold approaches $4,500 as record-setting rally continues

Gold builds on Monday's impressive gains and advances toward $4,500, setting fresh record-highs along the way. Heightened geopolitical tensions, combined with the broad-based US Dollar (USD) weakness ahead of the Q3 GDP data, help XAU/USD preserve its bullish momentum.

US GDP expected to highlight steady growth in Q3

The United States Bureau of Economic Analysis (BEA) will publish the first preliminary estimate of the third-quarter Gross Domestic Product on Tuesday, at 13:30 GMT. Analysts expect the data to show annualized growth of 3.2%, following the 3.8% expansion in the previous quarter.

Ten questions that matter going into 2026

2026 may be less about a neat “base case” and more about a regime shift—the market can reprice what matters most (growth, inflation, fiscal, geopolitics, concentration). The biggest trap is false comfort: the same trades can look defensive… right up until they become crowded.

XRP steadies above $1.90 support as fund inflows and retail demand rise

Ripple (XRP) is stable above support at $1.90 at the time of writing on Monday, after several attempts to break above the $2.00 hurdle failed to materialize last week. Meanwhile, institutional interest in the cross-border remittance token has remained steady.