|

EUR/GBP Price Analysis: Remains subdued and oscillates above 0.8600 amid risk-off impulse

  • EUR/GBP encounters resistance, lingering below the pivotal 200-DMA of 0.8700, spotlighting downside risks.
  • A breach below 0.8605 could unlock further descent, targeting September lows and potentially the YTD low.
  • Recovery above 0.8658 may pave the way for a test of the crucial 0.8700 psychological and technical barrier.

The EUR/GBP extended its losses to five straight trading days and hovers at around the September 28 swing low of 0.8629, amidst a risk-off impulse courtesy of the escalation of the fight between Hamas and Israel, set to extend for the fourth straight day. Therefore, the EUR/GBP edges lower by 0.05%, and exchanges hands at around 0.8635.

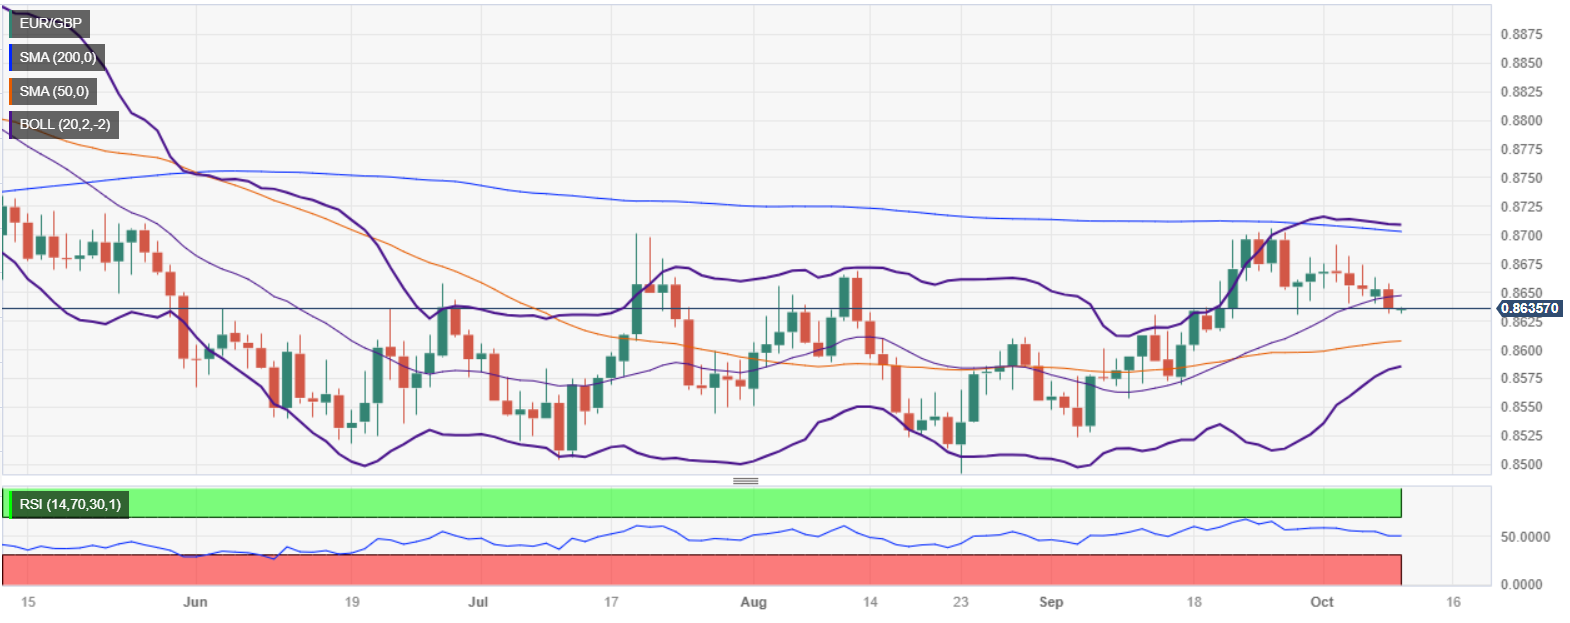
The daily chart portrays the pair as neutral biased, but it appears to have bottomed, as shown by price action; nevertheless, as EUR/GBP’s price action remains trading below the 200-day moving average (DMA) of 0.8700, downside risks remain. For a bearish continuation, sellers mist break below the 50-DMA at 0.8605. A breach of the latter and the 0.8600 figure would expose the September 15 daily low of 0.8569, followed by the September 5 low of 0.8523. Once those levels are cleared, up next would be the year-to-date (YTD) low of 0.8492.

Conversely, If EUR/GBP buyers reclaim the October 9 daily high at 0.8658, that would open the door to test the confluence of the figure and the 200-DMA at 0.8700. A decisive break would expose the May 3 high at 0.8834.

EUR/GBP Price Action – Daily chart

EUR/GBP Key Technicals

EUR/GBP

Overview
Today last price0.8636
Today Daily Change-0.0017
Today Daily Change %-0.20
Today daily open0.8653
 
Trends
Daily SMA200.8644
Daily SMA500.8606
Daily SMA1000.8601
Daily SMA2000.8705
 
Levels
Previous Daily High0.8663
Previous Daily Low0.8641
Previous Weekly High0.8691
Previous Weekly Low0.864
Previous Monthly High0.8706
Previous Monthly Low0.8524
Daily Fibonacci 38.2%0.8655
Daily Fibonacci 61.8%0.8649
Daily Pivot Point S10.8641
Daily Pivot Point S20.863
Daily Pivot Point S30.8619
Daily Pivot Point R10.8664
Daily Pivot Point R20.8675
Daily Pivot Point R30.8686

Author

Christian Borjon Valencia

Markets analyst, news editor, and trading instructor with over 14 years of experience across FX, commodities, US equity indices, and global macro markets.

More from Christian Borjon Valencia
Share:

Editor's Picks

AUD/USD eyes 0.7150 barrier nine-day EMA

AUD/USD inches higher after registering modest losses in the previous day, trading around 0.7130 during the Asian hours. The technical analysis of the daily chart indicates that the pair is moving sideways within the rectangle pattern, suggesting a consolidation as neither the bulls nor the bears have enough momentum to take control of the market.

USD/JPY trades below 160.00 intervention threshold; bullish bias intact

The USD/JPY pair attracts some sellers during the Asian session amid fears that authorities will step in again to prop up the Japanese Yen. Furthermore, the Israel-Lebanon truce prompts some profit-taking around the US Dollar and exerts downward pressure on the currency pair.

Gold defends 200-day SMA at $4,425, but for how long?

Gold is attempting a tepid recovery toward $4,500 early Thursday, as renewed optimism in the Mideast geopolitical front calms market nerves. This cautious optimism across Asian markets weighs on Oil prices, and diminishes the US Dollar’s safe-haven appeal, helping Gold stage a decent comeback from the weekly low of $4,424.


Hyperliquid: ETF demand, capital rotation fuel HYPE rally as Bitcoin melts

Hyperliquid price sustains an upward trend near its all-time high of $75.76 on Thursday after posting 80% gains in May, while Bitcoin (BTC) retraces below $65,000, triggering a market-wide panic.

Kevin Warsh takes the Fed helm: What it means for the US Dollar
The Federal Reserve moves away from the highly predictable "forward guidance" model of the Jerome Powell era to a new “Kevin Warsh environment”, characterized by less communication, more policy surprises, and an increased focus on the Fed's complex balance sheet.
Recession on paper: What really moves the Canadian Loonie now?

Statistics Canada handed the headline writers a gift and the analysts a headache. Real GDP shrank 0.1% on an annualized basis in the first quarter, and with the fourth quarter of 2025 revised down to a 1.0% contraction, that is two negative quarters in a row, the textbook definition of a technical recession and Canada's first since the pandemic.