|

EUR/GBP Price Analysis: Probing the 50-DMA at 0.8500 after a three-day rally

  • EUR/GBP is set to finish the week with gains of 0.49%.
  • Euro buyers stepped in around weekly lows below 0.8400, under the 20, 50, and 200-DMAs.
  • A daily close above 0.8500 might open the door for a re-test of 0.8600.

The EUR/GBP extended its rally to three consecutive days, breaking on its way north the 100-day EMA, though it struggled to get above the 50-day EMA after reaching a daily high at 0.8511. At the time of writing, the EUR/GBP is trading at 0.8493, above its opening price by 0.50%.

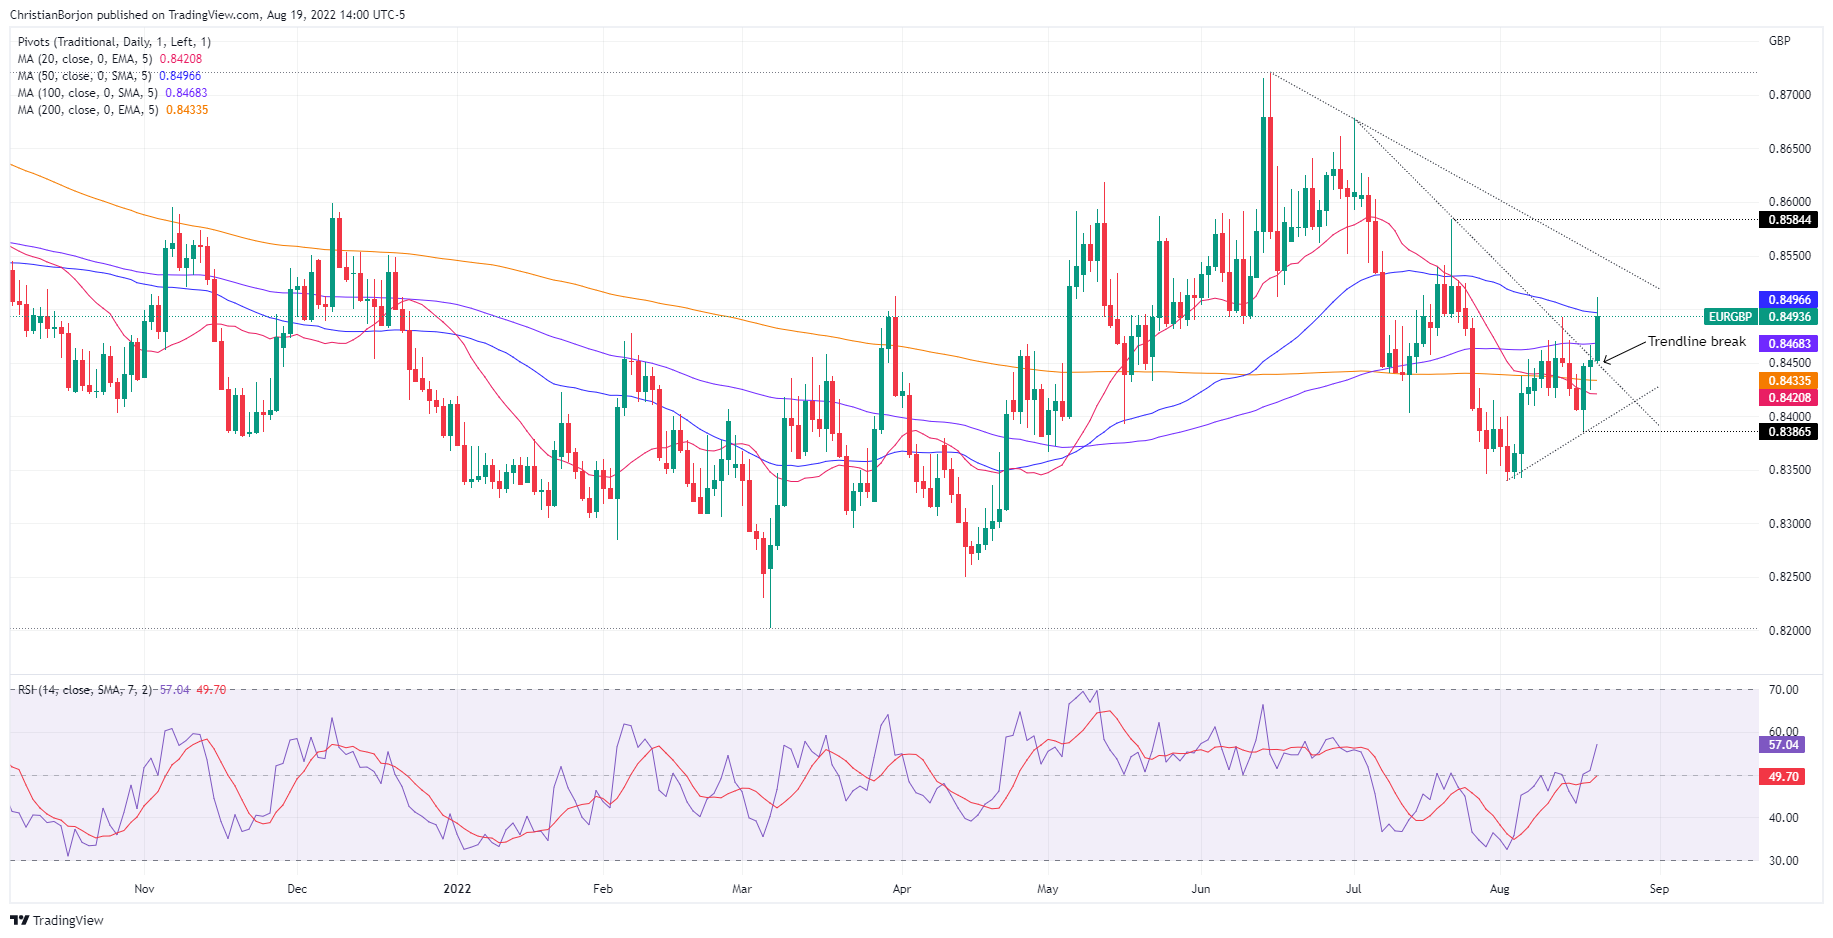
EUR/GBP Price Analysis: Technical outlook

From a daily chart perspective, the EUR/GBP shifted from neutral-downwards to neutral. In the last week, broad euro weakness tumbled the pair from current price levels towards 0.8400. However, EUR buyers stepped in around weekly lows at around 0.8386 and sent the cross-currency rallying toward the 0.8500 figure.

Worth noting that during the last three days, the EUR/GBP rally sparked a jump in the Relative Strength Index (RSI), a sign that momentum is on the side of buyers. Additionally, the break of a one-month-old downslope trendline around 0.8450 exacerbated a rally towards today’s high at 0.8511. So a break above the 0.8500 mark is on the cards.

Therefore, the EUR/GBP first resistance will be the confluence of the 50-day EMA at 0.8499 and the 0.8500 figure. Once cleared, the next stop will be Friday’s high at 0.8511, which, once broken, would aim towards a two-month-old downslope trendline around 0.8550 before climbing to the July 21 high at 0.8584.

EUR/GBP Daily chart

EUR/GBP Key Technical Levels


Overview
Today last price0.8493
Today Daily Change0.0033
Today Daily Change %0.39
Today daily open0.8459
 
Trends
Daily SMA200.8425
Daily SMA500.8502
Daily SMA1000.8472
Daily SMA2000.8438
 
Levels
Previous Daily High0.8467
Previous Daily Low0.8425
Previous Weekly High0.8493
Previous Weekly Low0.841
Previous Monthly High0.8679
Previous Monthly Low0.8346
Daily Fibonacci 38.2%0.8451
Daily Fibonacci 61.8%0.8441
Daily Pivot Point S10.8434
Daily Pivot Point S20.8408
Daily Pivot Point S30.8392
Daily Pivot Point R10.8475
Daily Pivot Point R20.8492
Daily Pivot Point R30.8517

Author

Christian Borjon Valencia

Markets analyst, news editor, and trading instructor with over 14 years of experience across FX, commodities, US equity indices, and global macro markets.

More from Christian Borjon Valencia
Share:

Editor's Picks

EUR/USD looks well bid above 1.1600

EUR/USD extends its recovery and climbs back above the 1.1600 mark in quite an auspicious start to the week. Improved risk appetite following the US-Iran agreement to reopen the Strait of Hormuz continues to weigh on the US Dollar, lending support to the risk complex. Looking ahead, investors are likely to remain on the sidelines ahead of Wednesday's FOMC meeting.

GBP/USD climbs to multi-day highs around 1.3460

GBP/USD remains comfortably in positive territory north of 1.3400 the figure on Monday. Cable continues to draw support from an improvement in market sentiment after reports that the US and Iran have reached a framework agreement aimed at ending the conflict and reopening the Strait of Hormuz.

Gold extends the recovery, targets $4,400

Gold rallies on Monday and climbs well above the $4,300 mark per troy ounce. The precious metal benefits from renewed selling pressure on the Greenback as investors reassess the implications of the US-Iran agreement to end hostilities and reopen the Strait of Hormuz. Market participants now turn their attention to Wednesday's FOMC gathering.


Crypto Today: Bitcoin, Ethereum, XRP recovery gathers strength as US-Iran reach peace agreement

Cryptocurrency prices remain broadly elevated on Monday, led by Bitcoin’s upswing toward $66,000. Altcoins, including Ethereum and Ripple, mirror Bitcoin’s momentum, trading above $1,700 and $1.18.

President Trump announced that the deal with Iran is complete
President Trump announced that the deal with Iran is complete and he authorises the toll-free opening of the Strait of Hormuz and removal of the US Naval blockade. While the agreement is made, it is expected to be signed on Friday to take effect. The Forex market looks stable and could react slowly to the positivity around the news as Iran still expresses its mistrust on the US.
4.2% headline, 0.2% core: Why the Fed's next hike may be targeting the wrong problem

May's CPI put headline inflation at 4.2% on the year, up from 3.8% in April and the hottest reading since April 2023, while core prices rose just 0.2% on the month, undershooting the 0.3% consensus and halving April's pace.