|

EUR/GBP Price Analysis: Pair hovers around 0.8330, bearish outlook intact

  • The EUR/GBP has steadily declined over the past trading days.
  • The RSI and MACD are both suggesting that selling pressure is rising.
  • Oversold conditions might prompt an upward correction.


The EUR/GBP pair has been in a steady decline over the past trading days and fell to 0.8330 on Thursday with 0.30% losses.

The Relative Strength Index (RSI) is suggesting that selling pressure is rising, with the RSI value at 33, in the near oversold area, and a declining slope. The Moving Average Convergence Divergence (MACD) also suggests that selling pressure is rising, with the MACD histogram red and rising. 

EUR/GBP Daily Chart

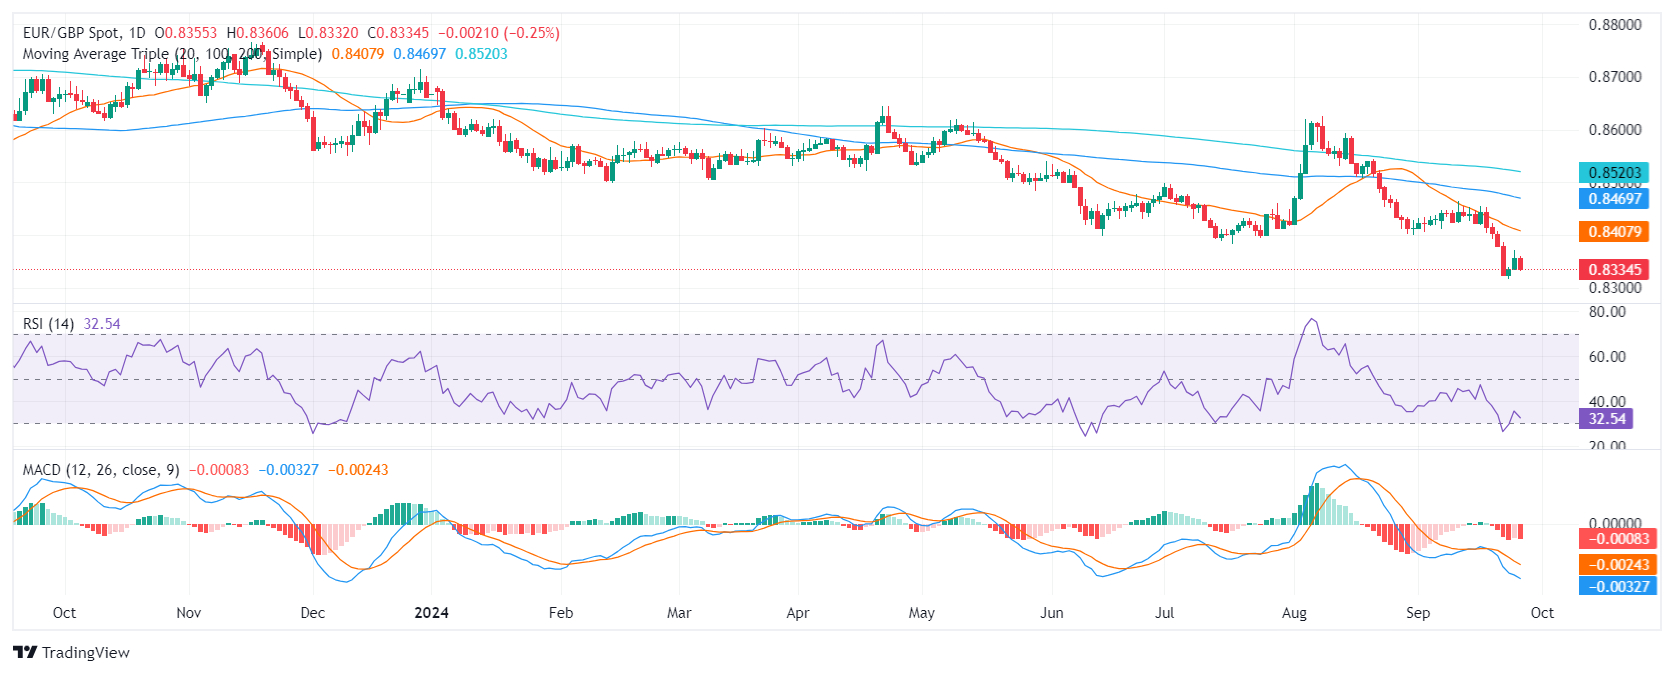
Based on the current technical picture, the EUR/GBP pair is likely to remain under pressure in the near term. The bears seem to be in control, and the bulls need to break above the 0.8400 resistance level to regain control. If the bears manage to break below the 0.8300 support level, the pair could fall further. However, with indicators flashing oversold signals, traders shouldn't take off the table an upward correction.

Author

Patricio Martín

Patricio is an economist from Argentina passionate about global finance and understanding the daily movements of the markets.

More from Patricio Martín
Share:

Editor's Picks

AUD/USD eyes 0.7150 barrier nine-day EMA

AUD/USD inches higher after registering modest losses in the previous day, trading around 0.7130 during the Asian hours. The technical analysis of the daily chart indicates that the pair is moving sideways within the rectangle pattern, suggesting a consolidation as neither the bulls nor the bears have enough momentum to take control of the market.

USD/JPY trades below 160.00 intervention threshold; bullish bias intact

The USD/JPY pair attracts some sellers during the Asian session amid fears that authorities will step in again to prop up the Japanese Yen. Furthermore, the Israel-Lebanon truce prompts some profit-taking around the US Dollar and exerts downward pressure on the currency pair.

Gold puts its 200-day SMA to the test near $4,420

Gold keeps the bullish stance in place in the latter part of Thursday’s session, although a convincing break above the key $4,500 mark per troy ounce still remains elusive. The precious metal’s advance comes amid the resurgence of some selling interest around the Greenback, improving risk sentiment, and declining US Treasury yields across the board.

Bitcoin’s massive storm is back: Why the sell-off is far from over

Bitcoin price action over the last few weeks has felt less like a normal, healthy correction and more like a slow grinding crash that continues to wreak havoc on holdings and trading accounts. And everything suggests that the dramatic crash isn’t over.

Nonfarm payrolls: Testing the limits of Fed policy patience

The upcoming nonfarm payrolls report for May will provide the final update on the US labor market before Kevin Warsh attends his first policy meeting as the new Fed Chair later this month.

Recession on paper: What really moves the Canadian Loonie now?

Statistics Canada handed the headline writers a gift and the analysts a headache. Real GDP shrank 0.1% on an annualized basis in the first quarter, and with the fourth quarter of 2025 revised down to a 1.0% contraction, that is two negative quarters in a row, the textbook definition of a technical recession and Canada's first since the pandemic.