|

EUR/GBP Price Analysis: Pair dips near range low despite bullish backdrop

  • EUR/GBP trades near the 0.8500 zone after sliding from earlier session levels
  • Despite the retreat, indicators and averages continue to favor a bullish setup
  • Support emerges around 0.8544 and 0.8507, with resistance seen near 0.8642

EUR/GBP edged lower on Tuesday after the European session, retreating toward the bottom of its intraday range while holding just above key technical levels. The pair was last seen near the 0.8500 area, down modestly on the day, yet broader signals still point to underlying bullish strength.

Momentum indicators remain mixed. The Relative Strength Index (RSI) is neutral at 58.46, showing no immediate threat of overbought or oversold conditions, while the Moving Average Convergence DIvergence (MACD) prints a bullish crossover, suggesting upward momentum could resume. Both the Stochastic %K at 69.95 and the Ultimate Oscillator at 49.06 are also neutral, offering limited directional bias in the short term.

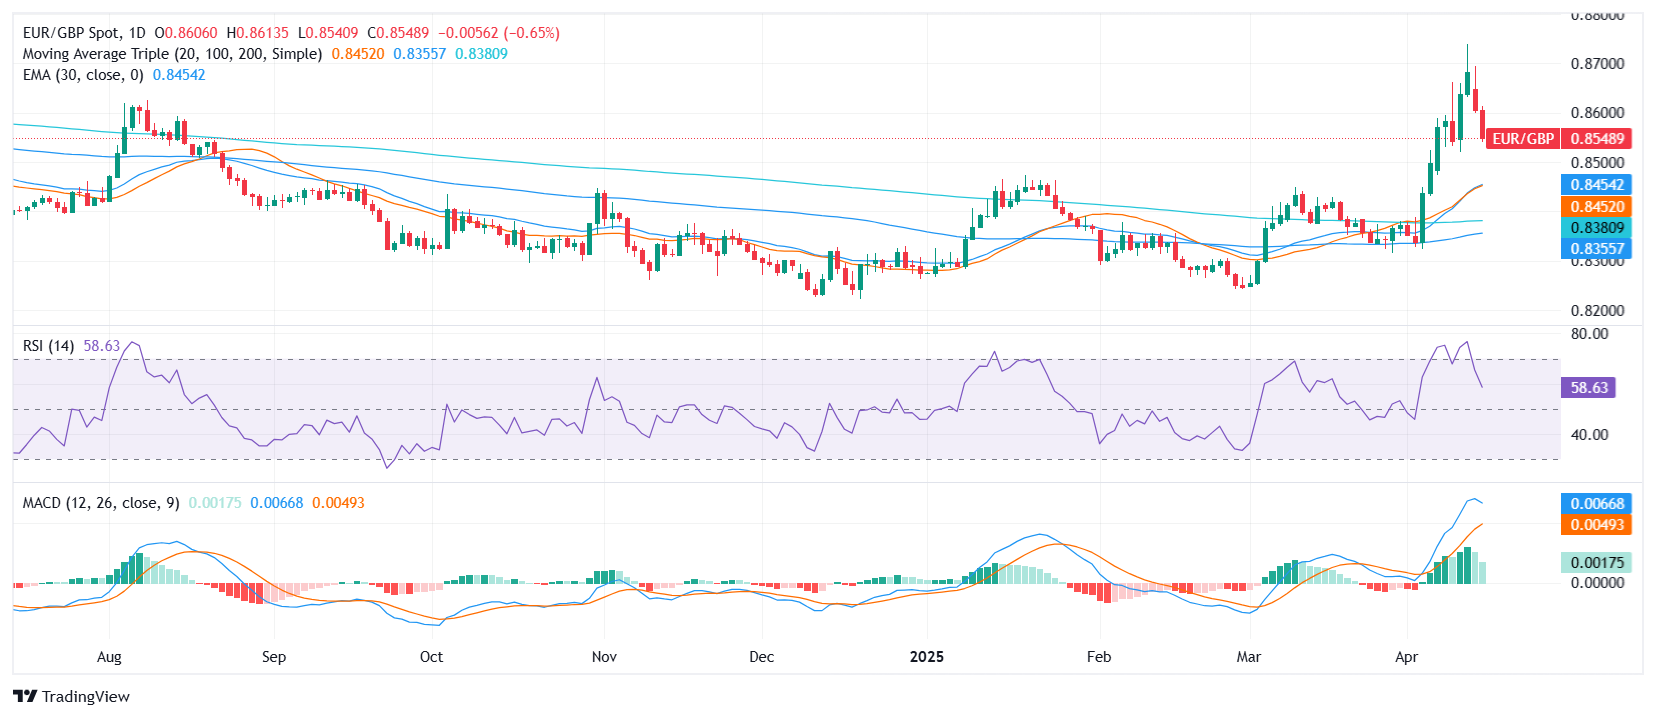
Key moving averages continue to support the bullish case. The 10-day EMA at 0.85468 and SMA at 0.85441 provide dynamic support, while longer-term averages — the 20-day SMA at 0.84520, 100-day at 0.83568, and 200-day at 0.83826 — all trend higher and sit comfortably below current price levels.

Daily chart

Author

Patricio Martín

Patricio is an economist from Argentina passionate about global finance and understanding the daily movements of the markets.

More from Patricio Martín
Share:

Editor's Picks

EUR/USD loses ground below 1.1850 ahead of FOMC Minutes

The EUR/USD pair loses traction near 1.1840 during the early European session on Wednesday, pressured by renewed US Dollar demand. Traders brace for the Federal Open Market Committee Minutes for signals on future rate cuts, which will be released later on Wednesday. 

When is the UK CPI data and how could it affect GBP/USD?

The United Kingdom Consumer Price Index data for January is scheduled to be published today at 07:00 GMT. GBP/USD trades slightly lower at around 1.3556 as of writing. The 20-period Exponential Moving Average trends lower at 1.3593 and continues to cap rebounds. Price holds beneath this gauge, maintaining a short-term bearish bias.

Gold: Is the $5,000 level back in sight?

Gold snaps a two-day downtrend, as recovery gathers traction toward $5,000 on Wednesday. The US Dollar recovers from the overnight sell-off as rebalancing trades resume ahead of Fed Minutes. The 38.2% Fib support holds on the daily chart for now. What does that mean for Gold?

Pi Network rally defies market pressure ahead of its first anniversary

Pi Network is trading above $0.1900 at press time on Wednesday, extending the weekly gains by nearly 8% so far. The steady recovery is supported by a short-term pause in mainnet migration, which reduces pressure on the PI token supply for Centralized Exchanges. The technical outlook focuses on the $0.1919 resistance as bullish momentum increases.

UK jobs market weakens, bolstering rate cut hopes

In the UK, the latest jobs report made for difficult reading. Nonetheless, this represents yet another reminder for the Bank of England that they need to act swiftly given the collapse in inflation expected over the coming months. 

Top 3 Price Prediction: Bitcoin, Ethereum, and Ripple face downside risk as bears regain control

Bitcoin, Ethereum, and Ripple remain under pressure on Wednesday, with the broader trend still sideways. BTC is edging below $68,000, nearing the lower consolidating boundary, while ETH and XRP also declined slightly, approaching their key supports.