|

EUR/GBP Price Analysis: Negative trend continues, downside risks prevail

  • EUR/GBP pair is on a four-day losing streak, reaching lows not seen in over a week
  • The MACD's rising red bars and declining RSI indicate increasing bearish momentum, suggesting further weakness for the pair.
  • Pair has broken deep below its 20-day SMA, reaching multi-week lows.

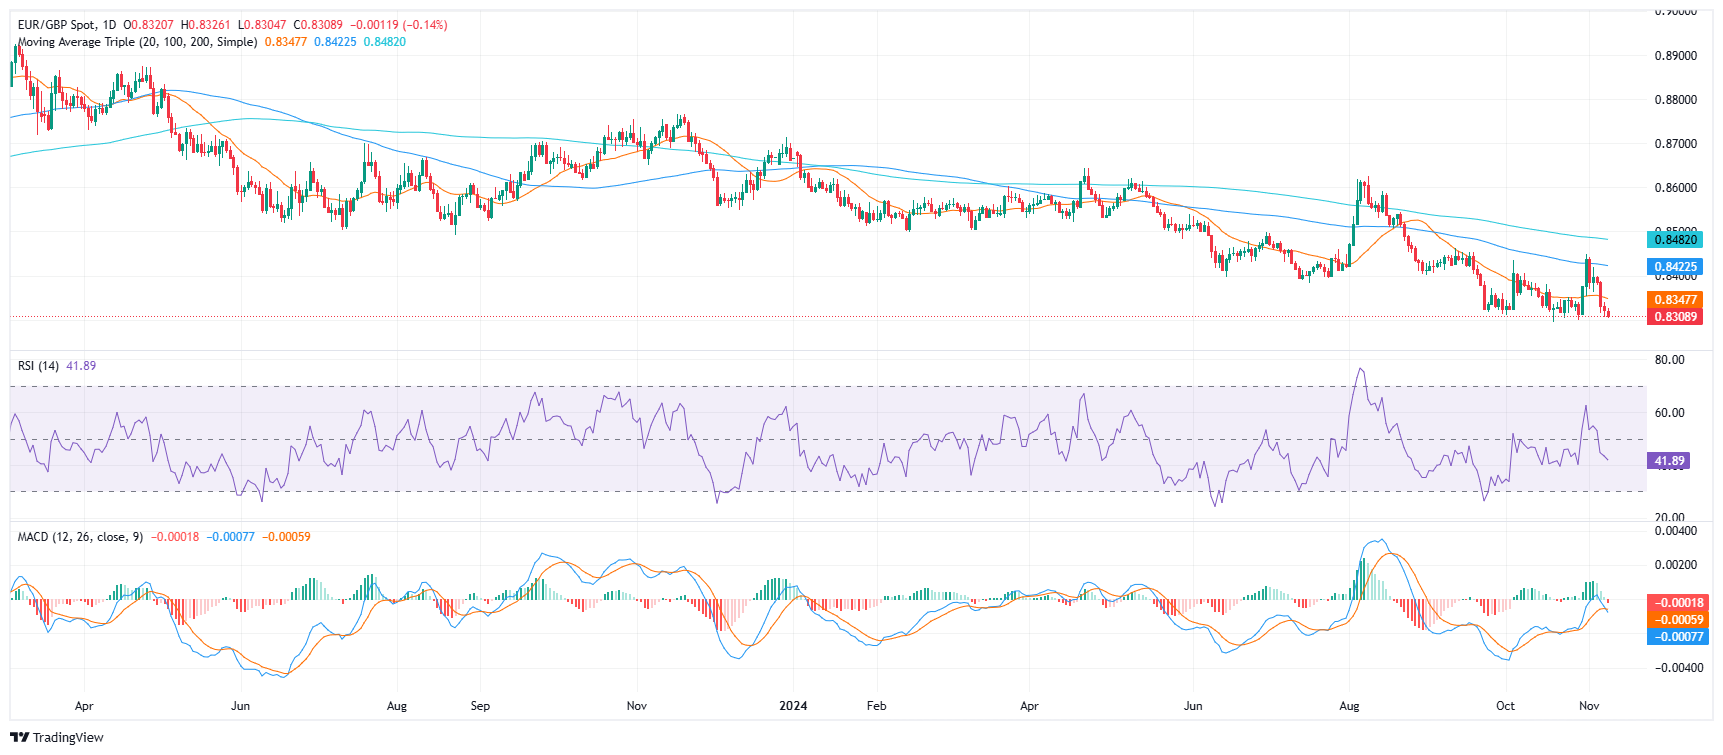
The EUR/GBP fell towards 0.8310 as sellers continue pushing downwards but will face strong support at the psychological 0.8300 area.
The cross has been on a downward trajectory, breaking below its 20-day SMA and reaching multi-week lows. Technical indicators such as the Relative Strength Index (RSI) and the Moving Average Convergence Divergence (MACD) confirm this bearish trend, signaling increasing selling momentum. The pair has recorded four consecutive days of losses, indicating that the selling pressure is intensifying, and further declines are possible.

The RSI is currently in negative territory at 42, with a mildly declining slope, implying that sellers are gaining momentum. The MACD's rising red histogram and elevated volume further support the bearish sentiment, indicating that bearish forces are dominating the market.

Support levels: 0.8300, 0.8275, 0.8250.
Resistance levels:0.8330, 0.8350, 0.8375. 

EUR/GBP daily chart
Author

Patricio Martín

Patricio is an economist from Argentina passionate about global finance and understanding the daily movements of the markets.


More from Patricio Martín
Share:

Editor's Picks

AUD/USD looks bid; retargets 0.7000

AUD/USD has managed to regain the 0.6900 hurdle and beyond in quite an auspicious start to the new trading week. The pair’s marked recovery has come on the back of the resurgence of the geopolitics-led selling pressure on the Greenback ahead of the release of key US CPI prints on Tuesday.

USD/JPY retreat in sync with USD, appraches 158.00

USD/JPY is back in the red at the start of the week on Monday, eyeing the broad US Dollar retreat amid easing US-Iran tensions. Traders also resorting to profit-taking following the blockbuster US Nonfarm Payrolls data-led rally. US CPI report is next in focus.

Gold keeps the bid tone near $4,100

Gold resumes its recovery on Monday, hovering around the $4,100 region per troy ounce. The precious metal’s solid performance comes amid fresh downside pressure on the US Dollar, rising US Treasury yields and a marked retracement in crude oil prices.

NYSE taps Avalanche for clearing and settlement of tokenized securities

Avalanche defied the crypto market drawdown on Monday, up 4% after announcing it will provide the core ledger technology for clearing in the New York Stock Exchange's upcoming tokenized securities trading platform.

US CPI preview: Moderation on the horizon, but underlying pressures linger
The US Consumer Price Index for October will be released on Tuesday, November 10, at a time when financial markets are receiving rather different signals from inflation, employment and credit conditions. September's inflation report showed headline consumer prices rising by 0.6% month over month, while core inflation increased by 0.3%.
Gold reclaimed $4,100. Tuesday’s CPI test decides if it holds
Gold (XAU/USD) starts the week on a positive note, reclaiming the $4,100 psychological level as the US Dollar (USD) retreats from its recent highs. The precious metal recovers from Friday's losses, although investors remain cautious ahead of Tuesday's US Consumer Price Index (CPI) report, which could determine the next direction for Bullion.