|

EUR/GBP Price Analysis: Gains traction as an inverted head-and-shoulders pattern looms

  • EUR/GBP gains for four consecutive days, up 0.81% for the week, trading at 0.8635 but failing to break through the 100-day EMA at 0.8655.
  • The Bank of England’s 25 bps rate hike influences the pair’s movement, capping further advance.
  • Technical outlook reveals an inverted head-and-shoulders chart pattern, targeting 0.8900.

EUR/GBP rallies for the fourth straight day, set to finish the week with gains of 0.81% but failed to crack the 100-day Exponential Moving Average (EMA) of 0.8655, tested on Thursday. The Bank of England’s (BoE) 25 bps rate hike was the reason that capped the EUR/GBP advance, though the EUR/GBP is trading sideways, slightly tilted to the upside. At the time of writing, the EUR/GBP exchanges hands at 0.8635, a gain of 0.23%.

EUR/GBP Price Analysis: Technical outlook

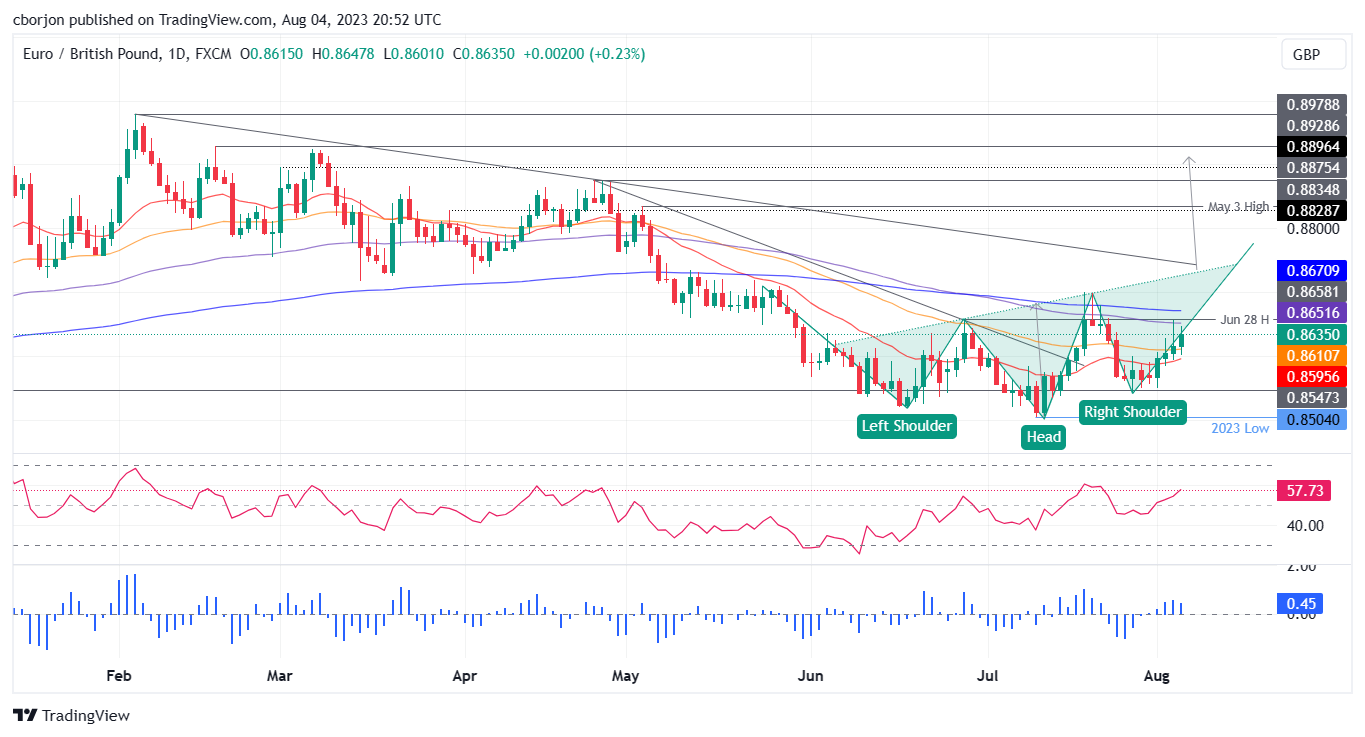
The daily chart portrays the pair forming an inverted head-and-shoulders chart pattern, but EUR/GBP’s price action has failed to decisively break above the 100 and 200-day EMAs at 0.8651 and 0.8671. Nevertheless, further validation is needed, as the EUR/GBP must break above 0.8740/50.

Once that cleared, the EUR/GBP first resistance would be 0.8800. A breach of the latter will expose the May 3 high at 0.8835, followed by the inverted head-and-shoulders minimum profit target of 0.8900. On the flip side, if EUR/GBP drops below the 50-day EMA at 0.8610, that could pave the way for further losses.

The EUR/GBP first support would be 0.8600, closely followed by the 20-day EMA at 0.8595. Once those levels are broken, the next support would emerge at the July 27 daily low of 0.8544, followed by the July 11 daily low of 0.8504.

EUR/GBP Price Action – Daily chart

EUR/GBP Daily chart

EUR/GBP

Overview
Today last price0.8638
Today Daily Change0.0022
Today Daily Change %0.26
Today daily open0.8616
 
Trends
Daily SMA200.8589
Daily SMA500.8589
Daily SMA1000.868
Daily SMA2000.8725
 
Levels
Previous Daily High0.8656
Previous Daily Low0.8596
Previous Weekly High0.8663
Previous Weekly Low0.8544
Previous Monthly High0.8701
Previous Monthly Low0.8504
Daily Fibonacci 38.2%0.8633
Daily Fibonacci 61.8%0.8619
Daily Pivot Point S10.8589
Daily Pivot Point S20.8563
Daily Pivot Point S30.853
Daily Pivot Point R10.8649
Daily Pivot Point R20.8682
Daily Pivot Point R30.8708

Author

Christian Borjon Valencia

Christian Borjon began his career as a retail trader in 2010, mainly focused on technical analysis and strategies around it. He started as a swing trader, as he used to work in another industry unrelated to the financial markets.

More from Christian Borjon Valencia
Share:

Markets move fast. We move first.

Orange Juice Newsletter brings you expert driven insights - not headlines. Every day on your inbox.

By subscribing you agree to our Terms and conditions.

Editor's Picks

EUR/USD moves sideways below 1.1800 on Christmas Eve

EUR/USD struggles to find direction and trades in a narrow channel below 1.1800 after posting gains for two consecutive days. Bond and stock markets in the US will open at the usual time and close early on Christmas Eve, allowing the trading action to remain subdued. 

GBP/USD keeps range around 1.3500 amid quiet markets

GBP/USD keeps its range trade intact at around 1.3500 on Wednesday. The Pound Sterling holds the upper hand over the US Dollar amid pre-Christmas light trading as traders move to the sidelines heading into the holiday season. 

Gold retreats from record highs, trades below $4,500

Gold retreats after setting a new record-high above $4,520 earlier in the day and trades in a tight range below $4,500 as trading volumes thin out ahead of the Christmas break. The US Dollar selling bias remains unabated on the back of dovish Fed expectations, which continues to act as a tailwind for the bullion amid persistent geopolitical risks.

Bitcoin slips below $87,000 as ETF outflows intensify, whale participation declines

Bitcoin price continues to trade around $86,770 on Wednesday, after failing to break above the $90,000 resistance. US-listed spot ETFs record an outflow of $188.64 million on Tuesday, marking the fourth consecutive day of withdrawals.

Economic outlook 2026-2027 in advanced countries: Solidity test

After a year marked by global economic resilience and ending on a note of optimism, 2026 looks promising and could be a year of solid economic performance. In our baseline scenario, we expect most of the supportive factors at work in 2025 to continue to play a role in 2026.

Avalanche struggles near $12 as Grayscale files updated form for ETF

Avalanche trades close to $12 by press time on Wednesday, extending the nearly 2% drop from the previous day. Grayscale filed an updated form to convert its Avalanche-focused Trust into an ETF with the US Securities and Exchange Commission.