• EUR/GBP drops below the 20-day as buyers’ momentum abate.
  • The Relative Strength Index (RSI) pierced the 50-midline but is almost flat.
  • The EUR/GBP 4-hour chart portrays a rising-wedge formed, targeting a fall towards 0.8600.

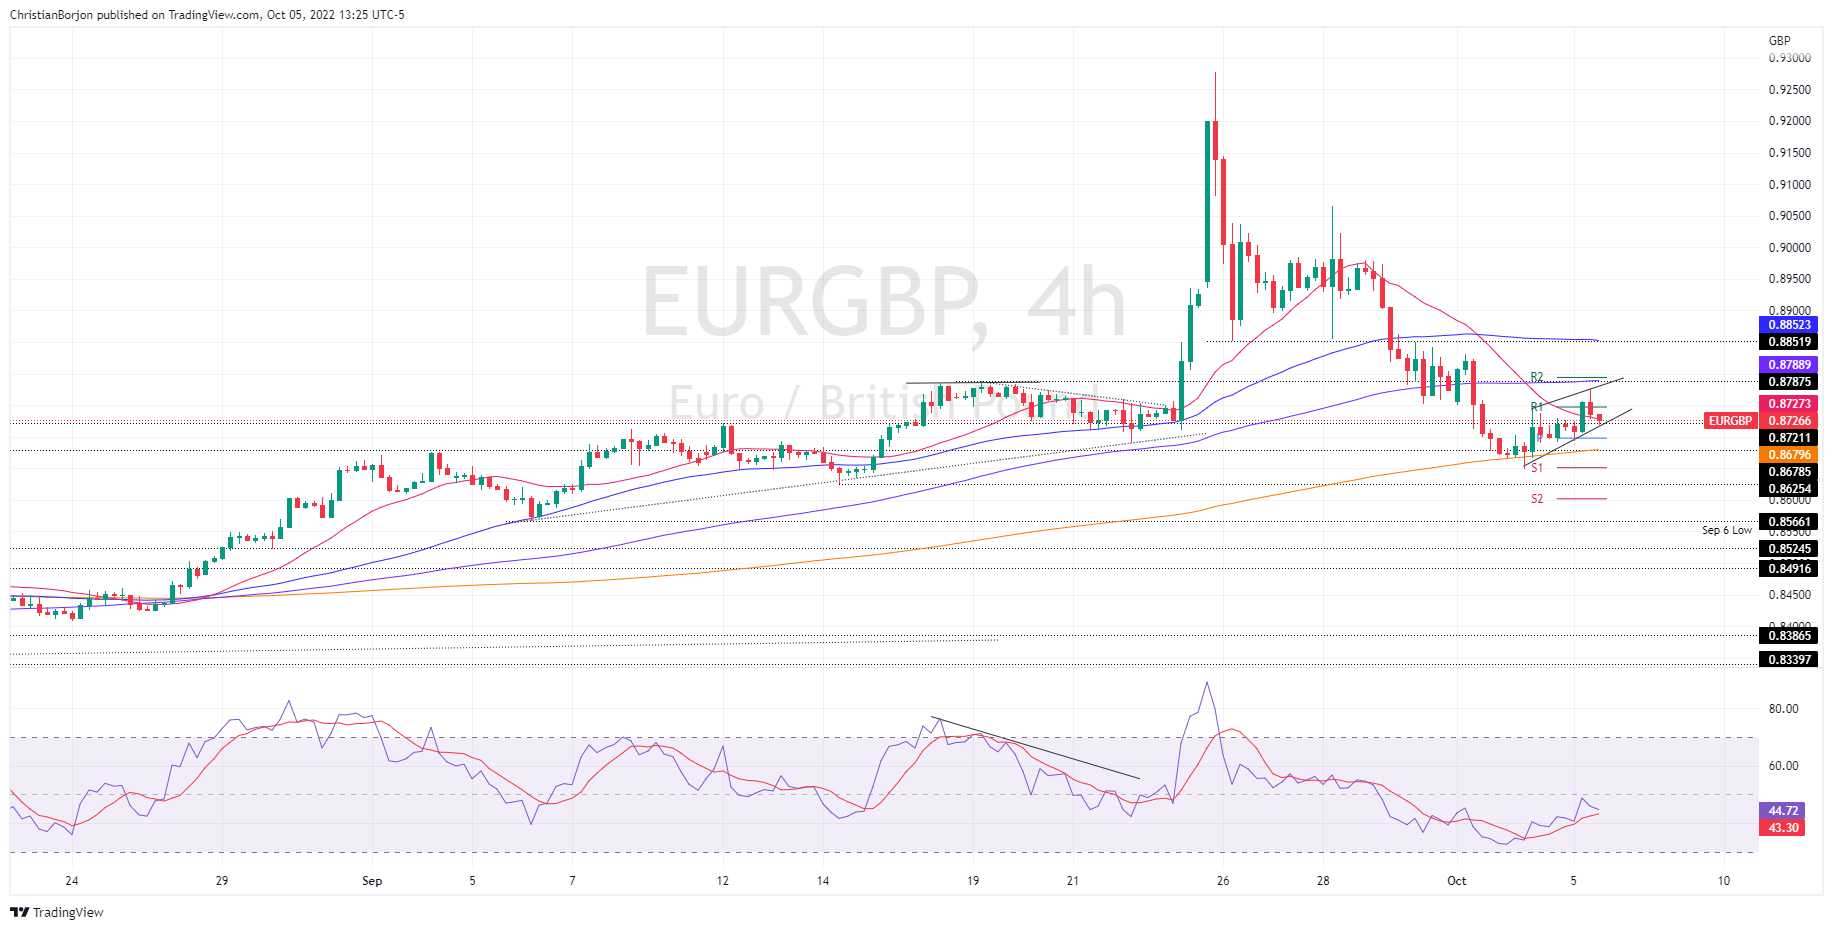
The EUR/GBP bounces off Tuesday’s close price and is edging higher, though solid resistance at around the 20-day EMA at 0.8768 put a lid on the cross-currency uptrend, retreating just below Tuesday’s high. However, the EUR/GBP remains positive, trading at 0.8726, above its opening price by 0.31%.

EUR/GBP Price Analysis: Technical outlook

During the last seven days, the pair’s volatility increased after the UK’s tax cut budget. Nevertheless, once the government backpedaled, the EUR/GBP tumbled from around 0.9277 to 0.8647 before recovering some ground. Given that the cross-currency pair dropped below the 20-day EMA and has been unable to crack it, the EUR/GBP is neutral bias. Additionally, the Relative Strength Index (RSI) entered the bearish territory but so far recovered and pierced the 50 mid-line. Nevertheless, price action’s failure to hold to gains above the 20-day EMA shows buyers might be losing momentum.

Short term, the EUR/GBP 4-hour chart depicts a rising-wedge formation, opening the door for further losses. If the EUR/GBP breaks below the bottom-trendline of the wedge, it could pave the way for further losses.

Therefore, the EUR/GBP first support would be the daily pivot at 0.8699. Once cleared, the next support would be the 200-EMA at 0.8679, followed by the S1 daily pivot at 0.8650, followed by the S2 daily pivot at 0.8600.

EUR/GBP Key Technical Levels

EUR/GBP

Overview
Today last price 0.8724
Today Daily Change 0.0022
Today Daily Change % 0.25
Today daily open 0.8702
 
Trends
Daily SMA20 0.8764
Daily SMA50 0.8587
Daily SMA100 0.8561
Daily SMA200 0.847
 
Levels
Previous Daily High 0.8745
Previous Daily Low 0.8649
Previous Weekly High 0.9254
Previous Weekly Low 0.8752
Previous Monthly High 0.9254
Previous Monthly Low 0.8566
Daily Fibonacci 38.2% 0.8708
Daily Fibonacci 61.8% 0.8686
Daily Pivot Point S1 0.8653
Daily Pivot Point S2 0.8603
Daily Pivot Point S3 0.8557
Daily Pivot Point R1 0.8748
Daily Pivot Point R2 0.8795
Daily Pivot Point R3 0.8844


Share: Feed news

Information on these pages contains forward-looking statements that involve risks and uncertainties. Markets and instruments profiled on this page are for informational purposes only and should not in any way come across as a recommendation to buy or sell in these assets. You should do your own thorough research before making any investment decisions. FXStreet does not in any way guarantee that this information is free from mistakes, errors, or material misstatements. It also does not guarantee that this information is of a timely nature. Investing in Open Markets involves a great deal of risk, including the loss of all or a portion of your investment, as well as emotional distress. All risks, losses and costs associated with investing, including total loss of principal, are your responsibility. The views and opinions expressed in this article are those of the authors and do not necessarily reflect the official policy or position of FXStreet nor its advertisers. The author will not be held responsible for information that is found at the end of links posted on this page.

If not otherwise explicitly mentioned in the body of the article, at the time of writing, the author has no position in any stock mentioned in this article and no business relationship with any company mentioned. The author has not received compensation for writing this article, other than from FXStreet.

FXStreet and the author do not provide personalized recommendations. The author makes no representations as to the accuracy, completeness, or suitability of this information. FXStreet and the author will not be liable for any errors, omissions or any losses, injuries or damages arising from this information and its display or use. Errors and omissions excepted.

The author and FXStreet are not registered investment advisors and nothing in this article is intended to be investment advice.

Recommended content


Recommended content

Editors’ Picks

EUR/USD edges lower toward 1.0700 post-US PCE

EUR/USD edges lower toward 1.0700 post-US PCE

EUR/USD stays under modest bearish pressure but manages to hold above 1.0700 in the American session on Friday. The US Dollar (USD) gathers strength against its rivals after the stronger-than-forecast PCE inflation data, not allowing the pair to gain traction.

EUR/USD News

GBP/USD retreats to 1.2500 on renewed USD strength

GBP/USD retreats to 1.2500 on renewed USD strength

GBP/USD lost its traction and turned negative on the day near 1.2500. Following the stronger-than-expected PCE inflation readings from the US, the USD stays resilient and makes it difficult for the pair to gather recovery momentum.

GBP/USD News

Gold struggles to hold above $2,350 following US inflation

Gold struggles to hold above $2,350 following US inflation

Gold turned south and declined toward $2,340, erasing a large portion of its daily gains, as the USD benefited from PCE inflation data. The benchmark 10-year US yield, however, stays in negative territory and helps XAU/USD limit its losses. 

Gold News

Bitcoin Weekly Forecast: BTC’s next breakout could propel it to $80,000 Premium

Bitcoin Weekly Forecast: BTC’s next breakout could propel it to $80,000

Bitcoin’s recent price consolidation could be nearing its end as technical indicators and on-chain metrics suggest a potential upward breakout. However, this move would not be straightforward and could punish impatient investors. 

Read more

Week ahead – Hawkish risk as Fed and NFP on tap, Eurozone data eyed too

Week ahead – Hawkish risk as Fed and NFP on tap, Eurozone data eyed too

Fed meets on Wednesday as US inflation stays elevated. Will Friday’s jobs report bring relief or more angst for the markets? Eurozone flash GDP and CPI numbers in focus for the Euro.

Read more

Forex MAJORS

Cryptocurrencies

Signatures