Share:
  • EUR/GBP pair drops to a new seven-day low of 0.8546, influenced by market expectations of a BoE rate hike and ECB's unchanged stance.
  • Technical analysis shows the pair struggling to break the 50-day SMA at 0.8582, maintaining a downtrend with a year-to-date low of 0.8492 in sight.
  • Despite the downtrend, a falling wedge pattern suggests an upside potential, with key resistance levels at 0.8572 and 0.8600 to watch.

The Euro (EUR) loses ground against the Pound Sterling (GBP) amid a risk-on impulse, as well as expectations for interest rates staying unchanged by the European Central Bank (ECB). At the same time, the Bank of England (BoE) is seen by market analysts as the only one to raise rates by 25 bps in September. That, alongside technical resistance, dragged the EUR/GBP to a new seven-day low, as the pair trades at 0.8546 after hitting a high of 0.8559.

EUR/GBP Price Analysis: Technical outlook

The daily chart portrays the pair tested the 50-day Simple Moving Average (SMA) at 0.8582, but buyers failed to pierce it on the upside, so the cross extended its losses toward current exchange rates. Due to the pair registering a successive series of lower highs and lows, the downtrend is intact, and if the pair breaches the year-to-date (YTD) low of 0.8492, August 24, 2022, would be tested at 0.8408.

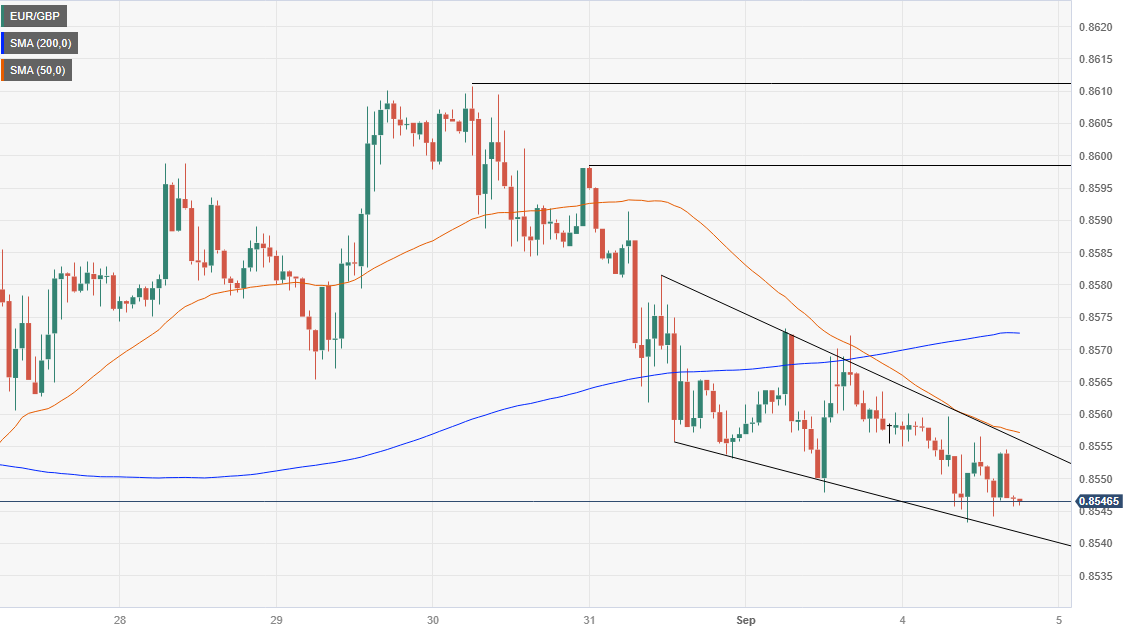
On an intraday bias, the EUR/GBP is trending down but is forming a falling wedge, a bullish chart pattern, that could pave the way for further upside. If the cross breaks to the upside, the first resistance would be the 200-hour SMA (HSMA) at 0.8572, followed by the psychological 0.8600 figure and last week’s high of 0.8610.

If the pair manages to remain within the chart pattern, further downside is seen at the bottom of the falling wedge at around 0.8530/20, which, if broken, the EUR/GBP could plunge towards the YTD low of 0.8492.

EUR/GBP Price Action – Hourly chart

EUR/GBP

Overview
Today last price 0.8547
Today Daily Change -0.0012
Today Daily Change % -0.14
Today daily open 0.8559
 
Trends
Daily SMA20 0.8578
Daily SMA50 0.8585
Daily SMA100 0.8635
Daily SMA200 0.8714
 
Levels
Previous Daily High 0.8573
Previous Daily Low 0.8548
Previous Weekly High 0.8611
Previous Weekly Low 0.8548
Previous Monthly High 0.8669
Previous Monthly Low 0.8493
Daily Fibonacci 38.2% 0.8564
Daily Fibonacci 61.8% 0.8558
Daily Pivot Point S1 0.8547
Daily Pivot Point S2 0.8535
Daily Pivot Point S3 0.8522
Daily Pivot Point R1 0.8572
Daily Pivot Point R2 0.8586
Daily Pivot Point R3 0.8598


Share: Feed news

Information on these pages contains forward-looking statements that involve risks and uncertainties. Markets and instruments profiled on this page are for informational purposes only and should not in any way come across as a recommendation to buy or sell in these assets. You should do your own thorough research before making any investment decisions. FXStreet does not in any way guarantee that this information is free from mistakes, errors, or material misstatements. It also does not guarantee that this information is of a timely nature. Investing in Open Markets involves a great deal of risk, including the loss of all or a portion of your investment, as well as emotional distress. All risks, losses and costs associated with investing, including total loss of principal, are your responsibility. The views and opinions expressed in this article are those of the authors and do not necessarily reflect the official policy or position of FXStreet nor its advertisers. The author will not be held responsible for information that is found at the end of links posted on this page.

If not otherwise explicitly mentioned in the body of the article, at the time of writing, the author has no position in any stock mentioned in this article and no business relationship with any company mentioned. The author has not received compensation for writing this article, other than from FXStreet.

FXStreet and the author do not provide personalized recommendations. The author makes no representations as to the accuracy, completeness, or suitability of this information. FXStreet and the author will not be liable for any errors, omissions or any losses, injuries or damages arising from this information and its display or use. Errors and omissions excepted.

The author and FXStreet are not registered investment advisors and nothing in this article is intended to be investment advice.

Follow us on Telegram

Stay updated of all the news

Join Telegram

Recommended content


Follow us on Telegram

Stay updated of all the news

Join Telegram

Recommended content

Editors’ Picks

NZD/USD rallies to a fresh three-month top after RBNZ's hawkish pause

NZD/USD rallies to a fresh three-month top after RBNZ's hawkish pause

The NZD/USD pair gains strong follow-through positive traction on Wednesday and spikes to a fresh three-month peak after the RBNZ announced its policy decision. The central bank left its cash rate unchanged at 5.5% and reiterated that rates will need to remain at a restricted level for a sustained period of time. 

NZD/USD News

AUD/USD hovers above a major level despite softer monthly CPI

AUD/USD hovers above a major level despite softer monthly CPI

The AUD/USD trades higher around the 0.6670 level, extending its gains for the fifth consecutive day on Wednesday. This surge is attributed to a heightened risk appetite in the market and the upward movement in commodity prices. Additionally, the softer US Dollar, influenced is providing support to the pair.

AUD/USD News

Gold rally extends into $2,040 as Fedspeak sparks Fed pivot bets

Gold rally extends into $2,040 as Fedspeak sparks Fed pivot bets

Gold price climbed on Tuesday in their best single-day performance in over six weeks, climbing 1.5% on the day and settling at a seven-month peak of $2,044. Markets saw a risk rally as investor sentiment bid up assets across the board, sparked by Dovish Fed comments that sent Gold climbing on the day.

Gold News

THORChain price climbs 15% as native RUNE secures self-custody wallet integration

THORChain price climbs 15% as native RUNE secures self-custody wallet integration

THORChain price is pumping hard, recording a 15% addition to its market value on the day, alongside a 50% rise in trading volume. When price and trading volume rise in tandem, it often points to the asset gaining attention and therefore interest among buyers. 

Read more

Global growth outlook remains cloudy and grey

Global growth outlook remains cloudy and grey

Prospects for the global economy have dimmed slightly over the past month, with restrictive monetary policy set to weigh on growth prospects for next year. The forecast for global GDP growth in 2023 remains unchanged at 2.8%, while the forecast for 2024 global GDP growth has been revised slightly lower to 2.3%. 

Read more

Forex MAJORS

Cryptocurrencies

Signatures