|

EUR/GBP Price Analysis: Bearish pressure rises , cross further below the 20-day SMA

  • The EUR/GBP declined on Thursday, extending its losses to three consecutive sessions.
  • Technical indicators suggest that the bearish trend may continue in the near term.
  • The pair is currently testing support at 0.8320-0.8330, with a break below this level potentially leading to further declines.

The EUR/GBP pair has been under pressure in recent sessions, breaking below its 20-day Simple Moving Average (SMA). This move has pushed the pair to its lowest point in over a week. Technical indicators are now signaling a potential increase in selling pressure, suggesting that the bearish trend may continue in the near term.

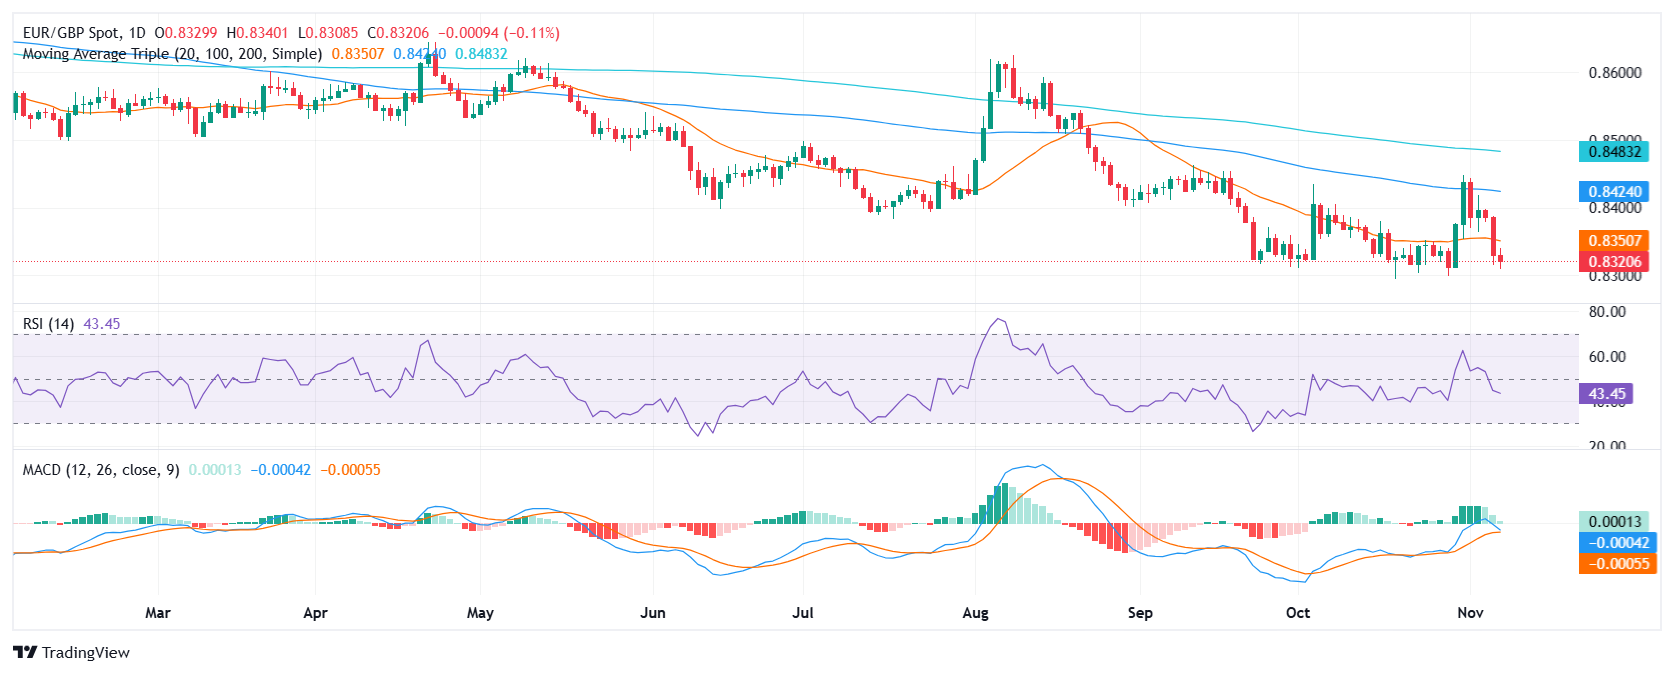
The Relative Strength Index (RSI) is at 44, indicating that the pair is in negative area. The slope of the RSI is mildly declining, suggesting that selling pressure is rising. The Moving Average Convergence Divergence (MACD) is green but decreasing, indicating that buying pressure is declining.

The EUR/GBP currency pair has witnessed a significant decline, breaking below its crucial 20-day Simple Moving Average (SMA). This move has pushed the pair to its lowest levels in over a week, indicating a shift in momentum. Technical indicators, such as the RSI and the MACD, are now signaling a buildup of selling pressure. The RSI has dropped below 50 neutral level, while the MACD prints lower green bars, suggesting a potential further decline in the EUR/GBP.

EUR/GBP daily chart

Author

Patricio Martín

Patricio is an economist from Argentina passionate about global finance and understanding the daily movements of the markets.

More from Patricio Martín
Share:

Editor's Picks

AUD/USD eyes 0.7150 barrier nine-day EMA

AUD/USD inches higher after registering modest losses in the previous day, trading around 0.7130 during the Asian hours. The technical analysis of the daily chart indicates that the pair is moving sideways within the rectangle pattern, suggesting a consolidation as neither the bulls nor the bears have enough momentum to take control of the market.

USD/JPY trades below 160.00 intervention threshold; bullish bias intact

The USD/JPY pair attracts some sellers during the Asian session amid fears that authorities will step in again to prop up the Japanese Yen. Furthermore, the Israel-Lebanon truce prompts some profit-taking around the US Dollar and exerts downward pressure on the currency pair.

Gold puts its 200-day SMA to the test near $4,420

Gold keeps the bullish stance in place in the latter part of Thursday’s session, although a convincing break above the key $4,500 mark per troy ounce still remains elusive. The precious metal’s advance comes amid the resurgence of some selling interest around the Greenback, improving risk sentiment, and declining US Treasury yields across the board.

Bitcoin’s massive storm is back: Why the sell-off is far from over

Bitcoin price action over the last few weeks has felt less like a normal, healthy correction and more like a slow grinding crash that continues to wreak havoc on holdings and trading accounts. And everything suggests that the dramatic crash isn’t over.

Nonfarm payrolls: Testing the limits of Fed policy patience

The upcoming nonfarm payrolls report for May will provide the final update on the US labor market before Kevin Warsh attends his first policy meeting as the new Fed Chair later this month.

Recession on paper: What really moves the Canadian Loonie now?

Statistics Canada handed the headline writers a gift and the analysts a headache. Real GDP shrank 0.1% on an annualized basis in the first quarter, and with the fourth quarter of 2025 revised down to a 1.0% contraction, that is two negative quarters in a row, the textbook definition of a technical recession and Canada's first since the pandemic.