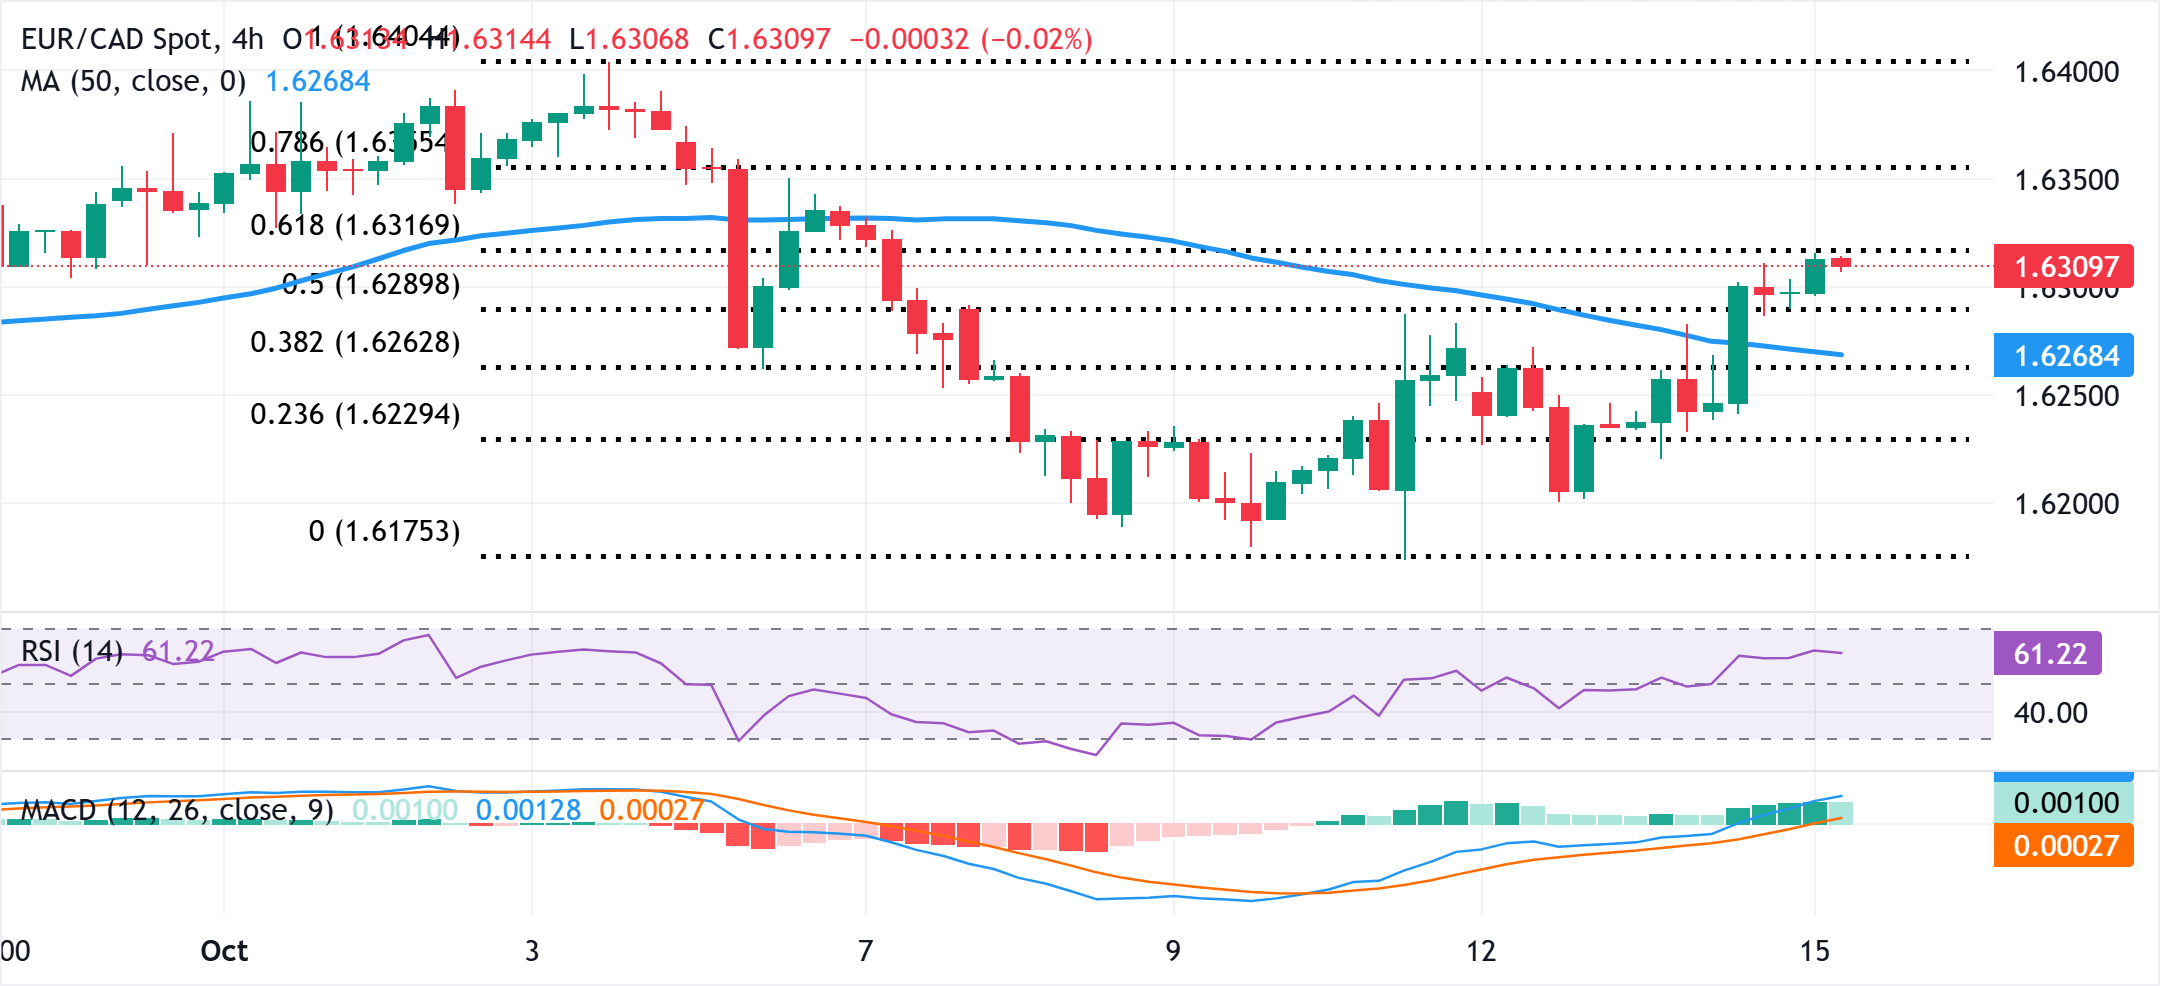
EUR/CAD Price Forecast: Seem poised to retest multi-year top, around 1.6400
- EUR/CAD extends the overnight breakout momentum above the 50% Fibo. retracement level.
- The technical setup favors bulls and backs the case for a further near-term appreciating move.
- Dips towards the 1.6270 area could be seen as a buying opportunity and remain cushioned.

The EUR/CAD cross is seen building on its recent bounce from the 1.6170-1.6175 area, or a three-week low touched last Friday, and gaining traction for the second straight day. This also marks the third day of a positive move in the previous four and lifts spot prices beyond the 1.6300 round figure, to a one-week top during the Asian session on Wednesday.
From a technical perspective, the overnight breakout through the 50% Fibonacci retracement level of the recent pullback from the 1.6400 mark, or the highest level since April 2009, touched earlier this month, could be seen as a key trigger for bulls. Moreover, oscillators on the daily chart have been gaining positive traction and back the case for a further appreciating move for the EUR/CAD pair.
Some follow-through buying beyond the 61.8% Fibo. retracement level, around the 1.6315 region, will reaffirm the constructive outlook and pave the way for a move towards the next relevant hurdle near mid-1.6300s. The momentum could extend further beyond the 1.6370-1.6375 horizontal resistance and allow the EUR/CAD cross to make a fresh attempt to conquer the 1.6400 round-figure mark.
On the flip side, weakness below the 50% Fibo. retracement level could attract some buyers near the 1.6270 zone and find decent support around the 1.6250-1.6245 region. This is followed by the 1.6220 region, or the overnight swing low, and the weekly trough, around the 1.6200 mark, which, if broken decisively, might negate the positive setup and shift the bias in favor of the EUR/CAD bears.
EUR/CAD 4-hour chart
Euro Price Today
The table below shows the percentage change of Euro (EUR) against listed major currencies today. Euro was the strongest against the New Zealand Dollar.
| USD | EUR | GBP | JPY | CAD | AUD | NZD | CHF | |
|---|---|---|---|---|---|---|---|---|
| USD | -0.11% | -0.21% | -0.33% | -0.06% | -0.47% | 0.06% | -0.15% | |
| EUR | 0.11% | -0.05% | -0.25% | 0.04% | -0.32% | 0.14% | -0.04% | |
| GBP | 0.21% | 0.05% | -0.18% | 0.13% | -0.26% | 0.17% | 0.07% | |
| JPY | 0.33% | 0.25% | 0.18% | 0.25% | -0.13% | 0.23% | 0.28% | |
| CAD | 0.06% | -0.04% | -0.13% | -0.25% | -0.41% | 0.04% | -0.06% | |
| AUD | 0.47% | 0.32% | 0.26% | 0.13% | 0.41% | 0.43% | 0.33% | |
| NZD | -0.06% | -0.14% | -0.17% | -0.23% | -0.04% | -0.43% | -0.10% | |
| CHF | 0.15% | 0.04% | -0.07% | -0.28% | 0.06% | -0.33% | 0.10% |
The heat map shows percentage changes of major currencies against each other. The base currency is picked from the left column, while the quote currency is picked from the top row. For example, if you pick the Euro from the left column and move along the horizontal line to the US Dollar, the percentage change displayed in the box will represent EUR (base)/USD (quote).
Author

Haresh Menghani
FXStreet
Haresh Menghani is a detail-oriented professional with 10+ years of extensive experience in analysing the global financial markets.


