|

EUR/CAD Price Forecast: Breaks out of rectangular price pattern and declines

  • EUR/CAD has broken below the base of a multi-month price pattern. 
  • It is likely to go lower if the break is decisive and it can pierce below the 200-day SMA. 

EUR/CAD has broken out of the rectangular price pattern it has been forming since August.

EUR/CAD Daily Chart 

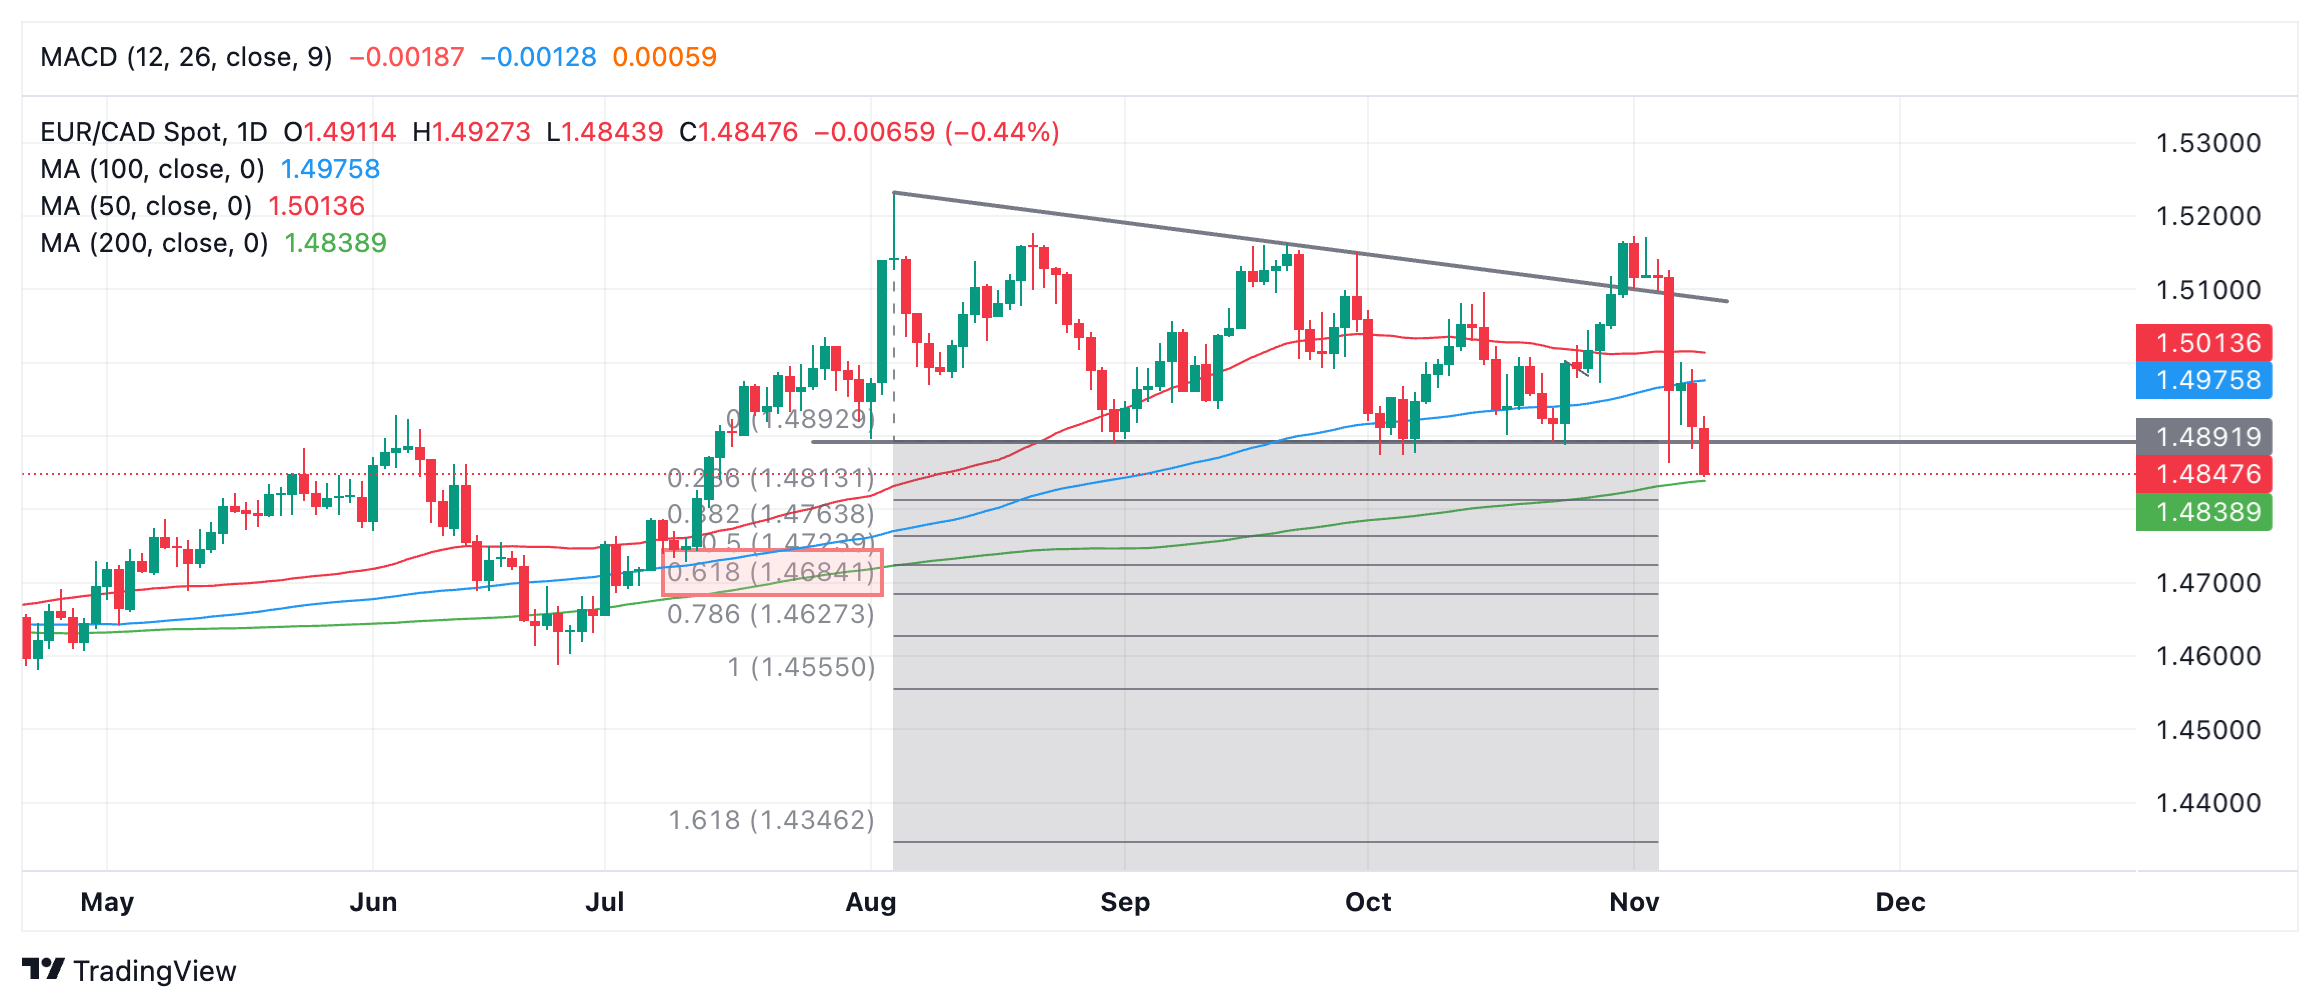
A bearish close on Monday (today) would confirm a decisive breakout from the pattern. The usual method for determining the follow-through after a breakout would be to take the height of the range and extrapolate it lower by 61.8% – or in the case of an optimistic forecast 100%. 

In the case of EUR/CAD this gives a minimum  downside target of 1.4684. A break clearly below the green 200-day Simple Moving Average (SMA) would provide confirmation. The SMA lies at 1.4839, however, a break below 1.4820 would confirm a clear break and probably confirm a continuation lower to the aforementioned conservative target. 

The 100% target for the pattern lies at 1.4555.

Author

Joaquin Monfort

Joaquin Monfort is a financial writer and analyst with over 10 years experience writing about financial markets and alt data. He holds a degree in Anthropology from London University and a Diploma in Technical analysis.

More from Joaquin Monfort
Share:

Markets move fast. We move first.

Orange Juice Newsletter brings you expert driven insights - not headlines. Every day on your inbox.

By subscribing you agree to our Terms and conditions.

Editor's Picks

EUR/USD trades with negative bias around 1.1730 amid recovering USD; downside seems limited

The EUR/USD pair kicks off the new week on a softer note, though it remains within striking distance of the highest level since early October, touched last Thursday. Spot prices currently trade around the 1.1730 region, down less than 0.10% for the day.

GBP/USD holds steady above mid-1.3300s as traders await key data and BoE this week

The GBP/USD pair remains on the defensive during the Asian session on Monday, though it lacks bearish conviction and holds above the 200-day Simple Moving Average pivotal support. Spot prices currently trade around the 1.3360 region, nearly unchanged for the day.

Gold retains bullish bias ahead of this week’s key US macro releases

Gold attracts buyers for the fifth straight day and climbs to the $4,330 region during the Asian session on Monday. The commodity remains well within striking distance of its highest level since October 21, touched on Friday, and seems poised to appreciate further amid a supportive fundamental backdrop. 

Solana consolidates as spot ETF inflows near $1 billion signal institutional dip-buying

Solana price hovers above $131 at the time of writing on Monday, nearing the upper boundary of a falling wedge pattern, awaiting a decisive breakout. On the institutional side, demand for spot Solana Exchange-Traded Funds remained firm, pushing total assets under management to nearly $1 billion since launch. 

Big week ends with big doubts

The S&P 500 continued to push higher yesterday as the US 2-year yield wavered around the 3.50% mark following a Federal Reserve (Fed) rate cut earlier this week that was ultimately perceived as not that hawkish after all. The cut is especially boosting the non-tech pockets of the market.

Solana Price Forecast: SOL consolidates as spot ETF inflows near $1 billion signal institutional dip-buying

Solana (SOL) price hovers above $131 at the time of writing on Monday, nearing the upper boundary of a falling wedge pattern, awaiting a decisive breakout.