Equity euphoria meets the fear reawakening: Nasdaq and S&P 500 near exhaustion

The E-Mini Nasdaq and S&P 500 approach the final wave of their five-year bull cycles, while Gold and the VIX begin to turn — signalling a possible shift from complacency to caution across global markets.
The calm before the turn
Global equity markets remain euphoric as the E-Mini Nasdaq and S&P 500 push toward record highs. Beneath the surface, however, subtle shifts in intermarket structure are emerging — Gold Futures are showing early signs of reversal, and the VIX volatility index has quietly built a base after months of calm.
This combination — equity indices nearing technical exhaustion while defensive assets and volatility begin to firm — echoes past transitions in 2018, 2020, and 2021, where market sentiment shifted rapidly from confidence to caution.
Nasdaq and S&P 500: The final wave of a five-year cycle
The E-Mini Nasdaq is advancing into a crucial resistance zone between 26,324 and 27,207, completing what appears to be the final leg of a five-year Elliott wave structure that began in 2020. The RSI hovering near 70 and flattening momentum suggest the rally may be running on borrowed time.
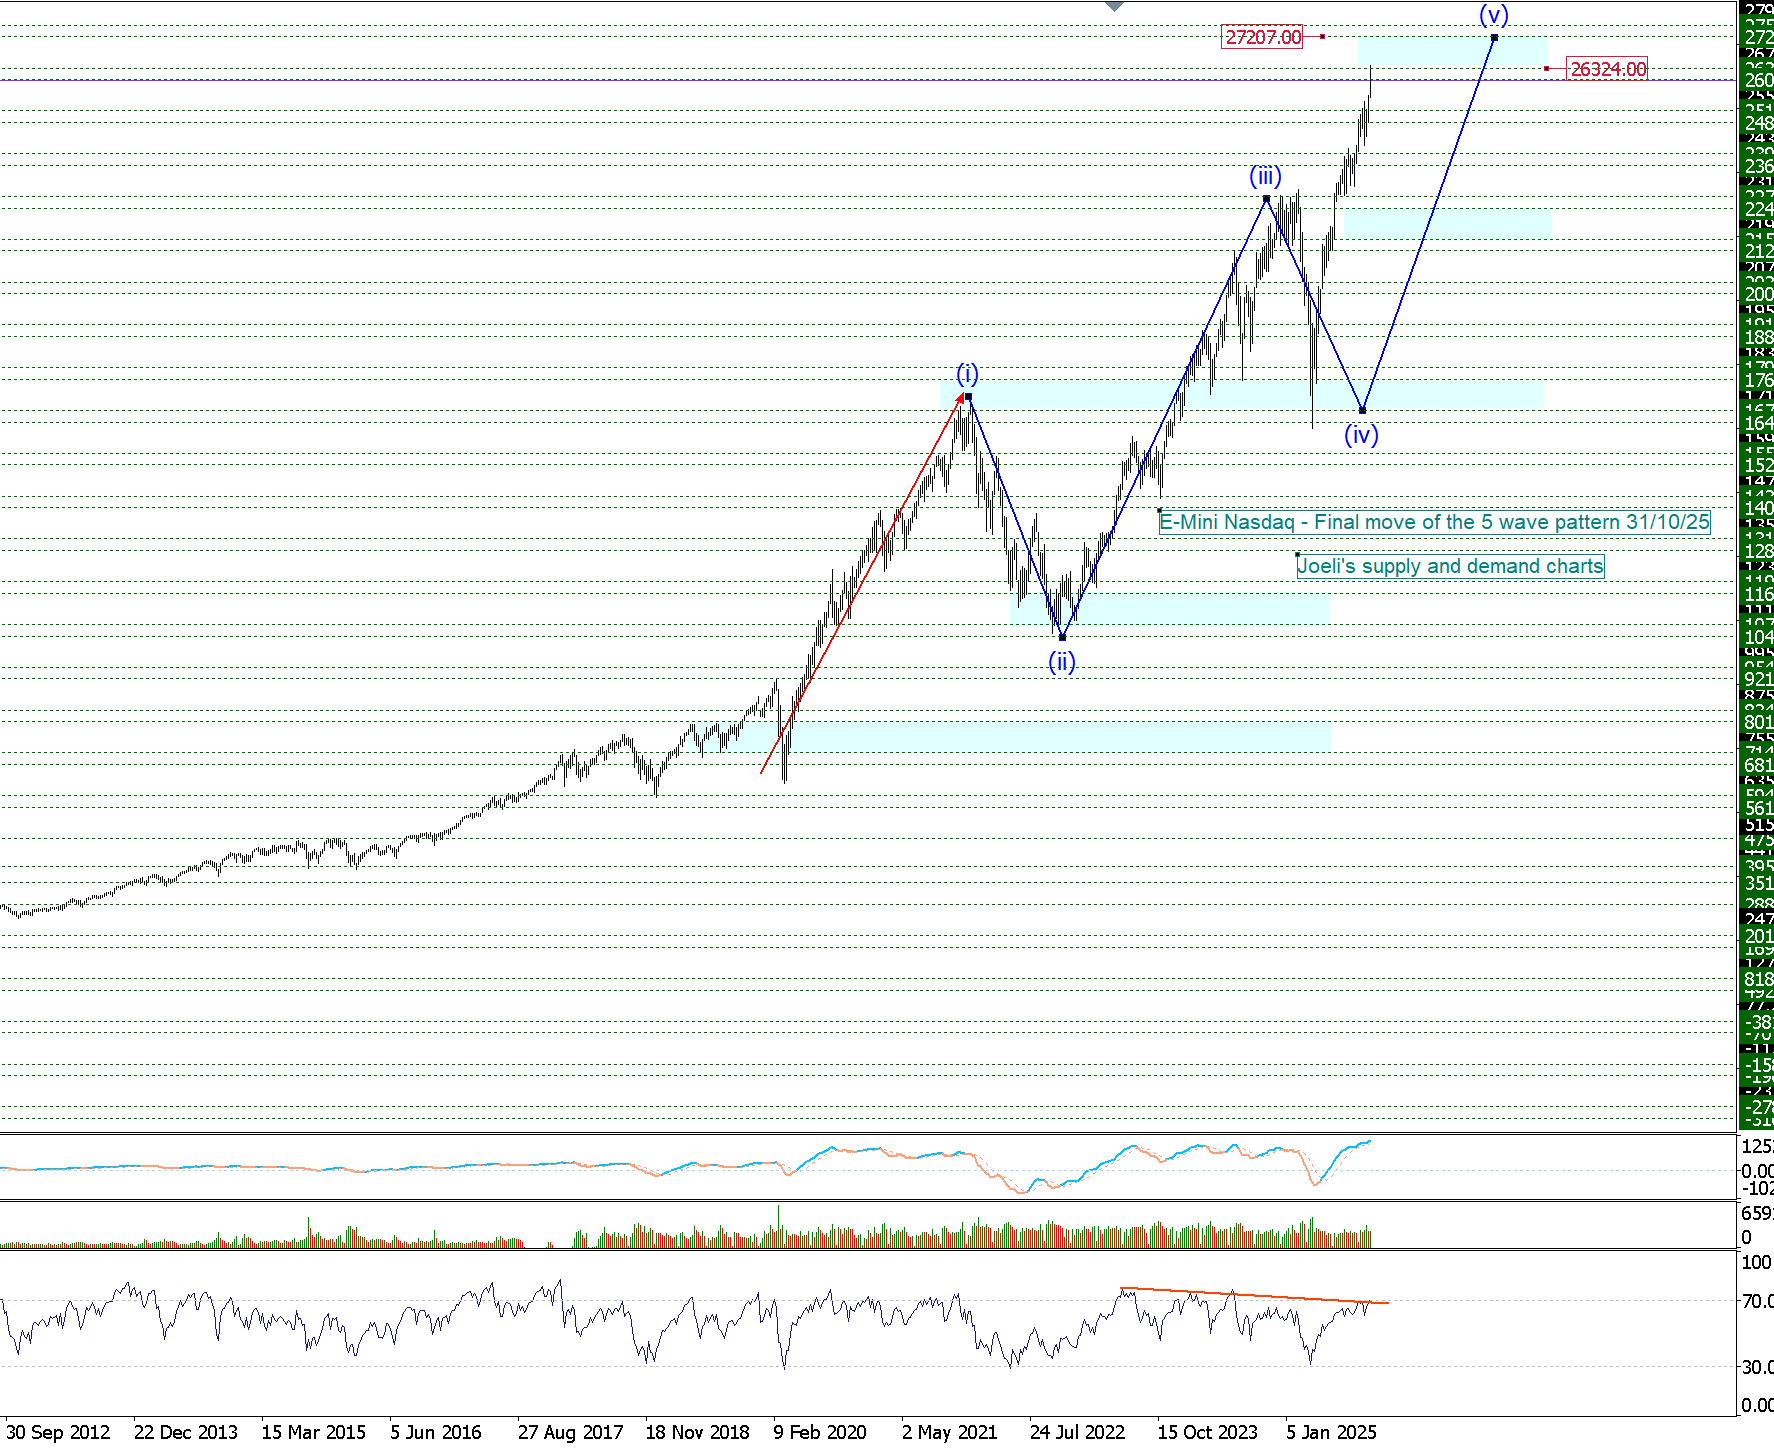
E-Mini Nasdaq approaches major resistance zones as Gold and the VIX begin to diverge.
Similarly, the E-Mini S&P 500 is testing the 7,471–7,230 region — a major supply zone that coincides with Fibonacci extensions of prior waves. Both indices have experienced two significant corrections within this broader structure, each followed by a rebound that maintained the bull trend. A similar outcome this time would imply a potential 15–35% pullback, targeting the 6,244 zone for the S&P and 22,409–21,536 for the Nasdaq.
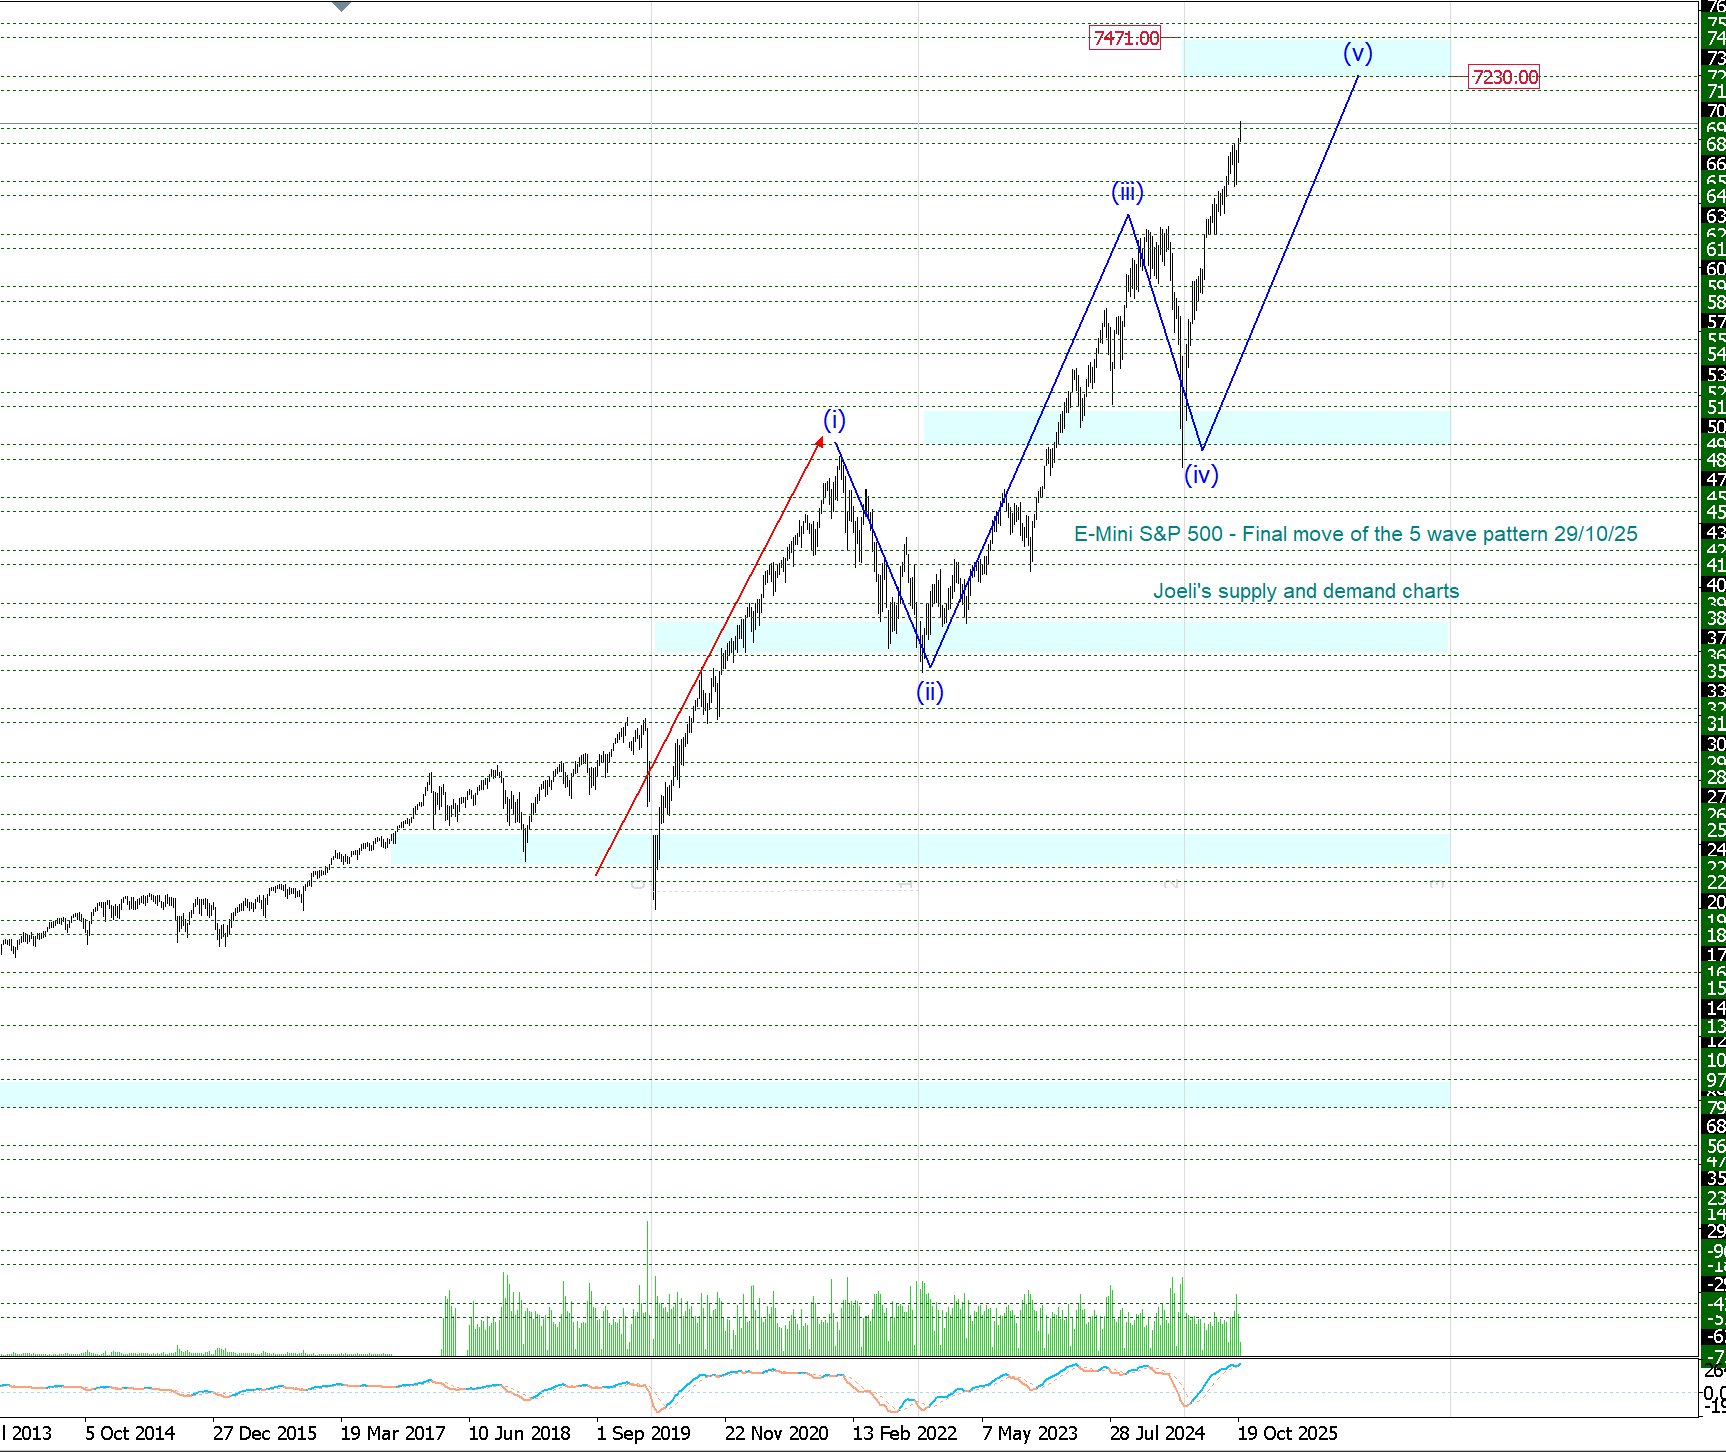
E-Mini S&P 500 approaches major resistance zones as Gold and the VIX begin to diverge.
Macro conditions align with this exhaustion. Yields remain elevated near 4.5%, profit growth is decelerating, and liquidity continues to tighten as fiscal issuance expands. These late-cycle factors, combined with historically stretched valuations, suggest that the current rally could mark the terminal phase of the post-pandemic bull market.
Gold futures: A reversal base amid divergence
While equities test their upper bounds, Gold Futures (Nov 2025) are forming a potential reversal structure. After rallying from 3,528 in September to a high of 4,377, prices corrected sharply, creating a potential three-drives pattern into the 3,871–3,921 demand zone.
This zone is critical — it aligns with previous breakout levels and a key value area on the volume profile. The RSI recently rebounded from the 30 level, and the momentum histogram is turning upward, signalling early buying interest.
A decisive breakout above 4,000 would confirm the next leg of Gold's bullish continuation, targeting 4,263–4,377 and potentially higher. The reversal setup coincides with growing divergence between Gold and equities, often seen during late-stage bull markets when investors begin rotating into hard assets as a hedge against liquidity stress and inflation persistence.
Historically, Gold's leadership over equities has signalled macro inflexion points—evident in 2000, 2008, and 2022—where capital rotated from growth to safety.
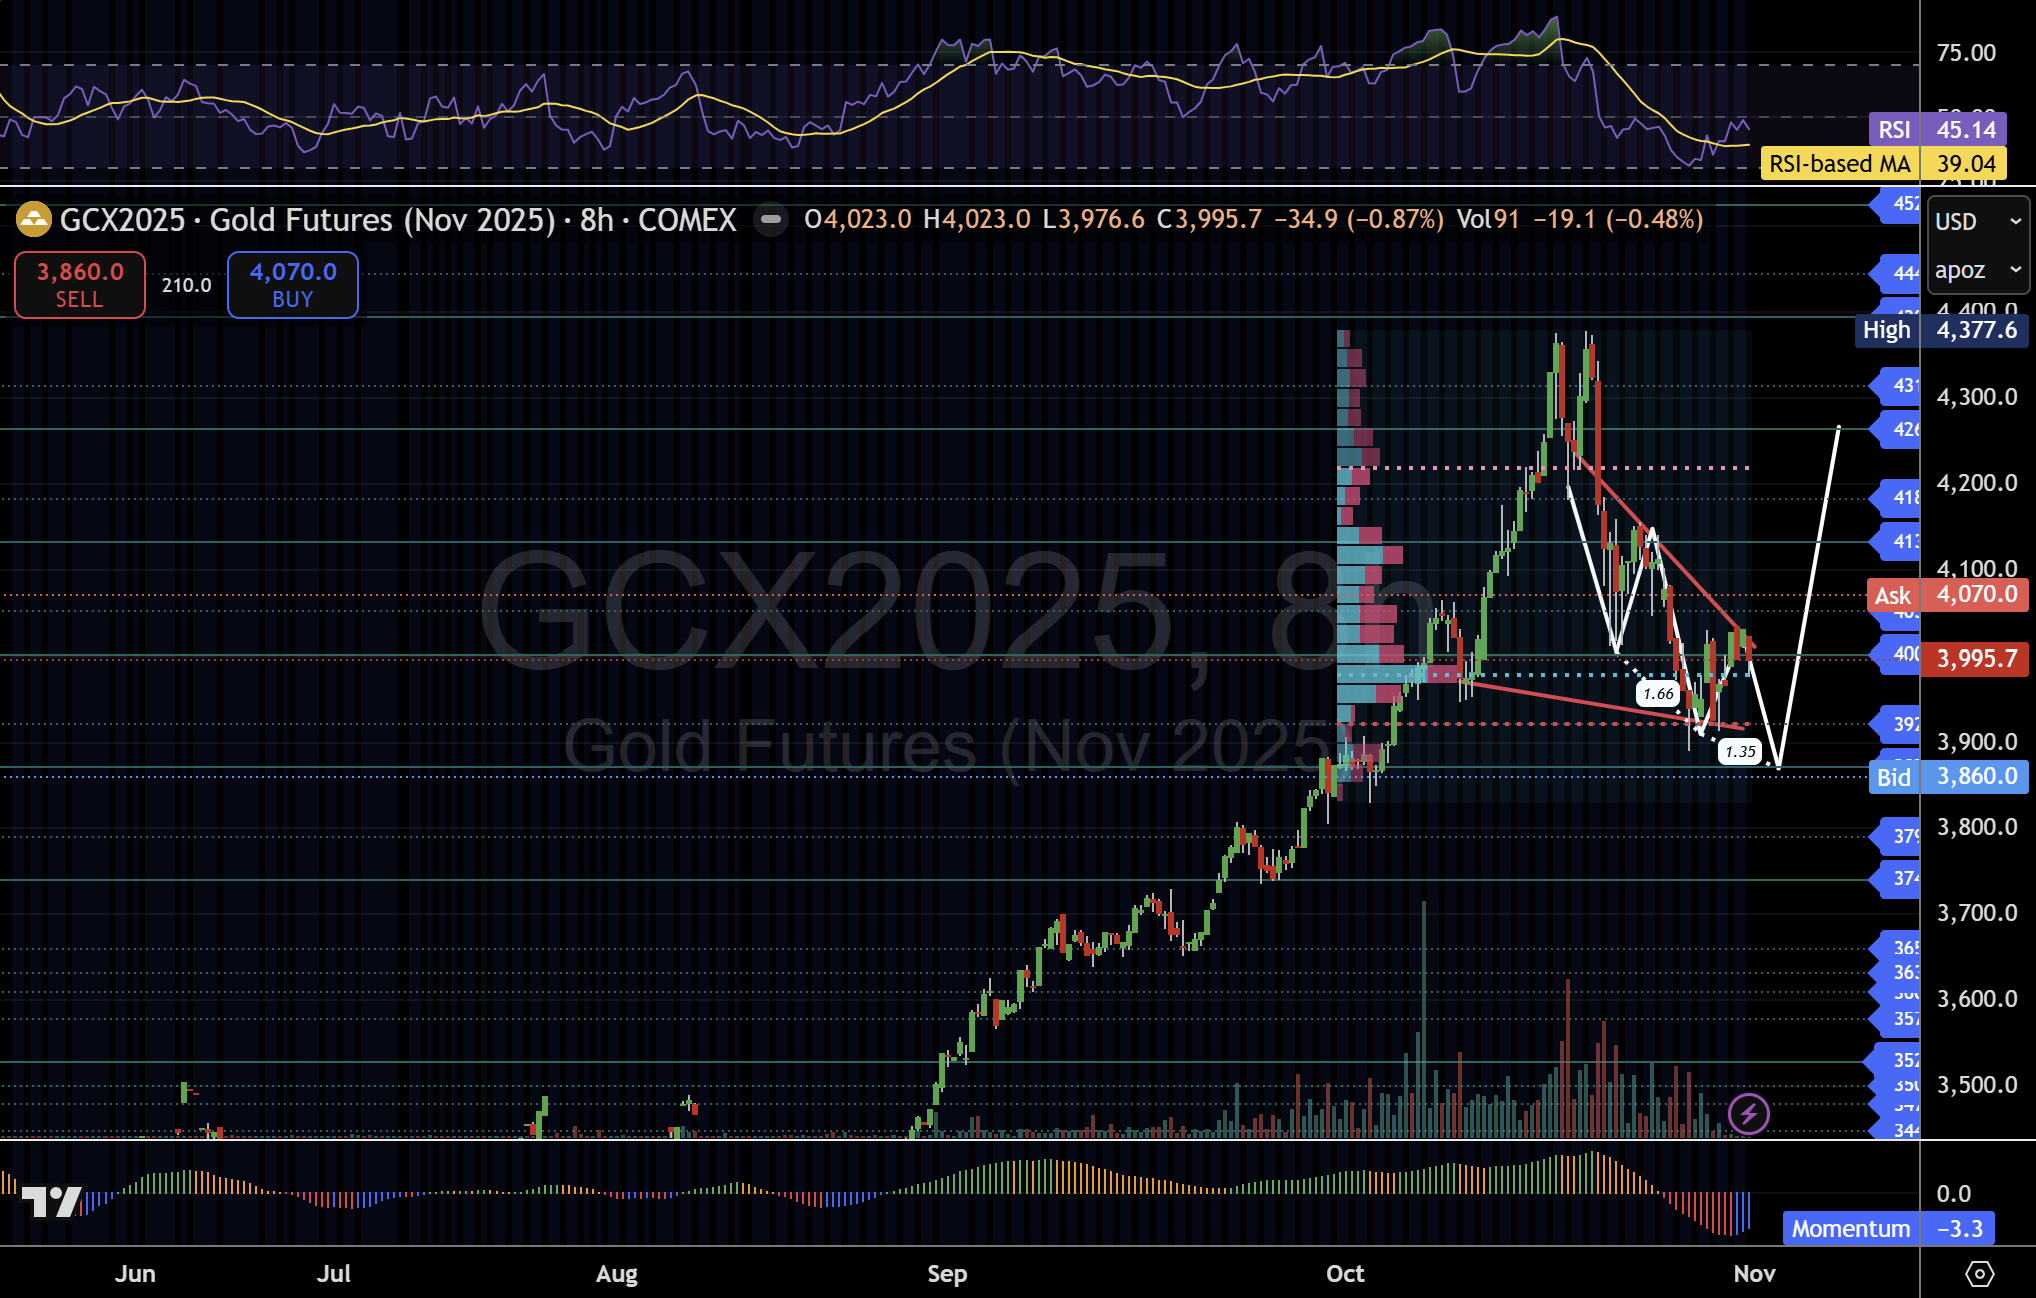
Gold creates a potential three-drives pattern to 3,871–3,921; a breakout above 4,000 could confirm the next leg of the bullish cycle.
VIX: The quiet rebuild of fear
The CBOE Volatility Index (VIX) is holding firm above 15.66, forming a steady base following its retreat from 28–40 in October. Support at 13.96 marks the lower bound of a year-long consolidation, suggesting volatility has likely bottomed.
A break and sustained move above 21 would signal the start of a volatility expansion phase, with potential targets at 28.40, 32.86, and even 54–61, historically associated with sharp market corrections.
This behaviour—equities making new highs while volatility refuses to make new lows—represents a classic intermarket warning. It indicates that institutional hedging is rising beneath the surface, even as retail sentiment remains optimistic. Similar setups preceded volatility spikes in 2018, 2020, and 2022, each followed by significant equity drawdowns.
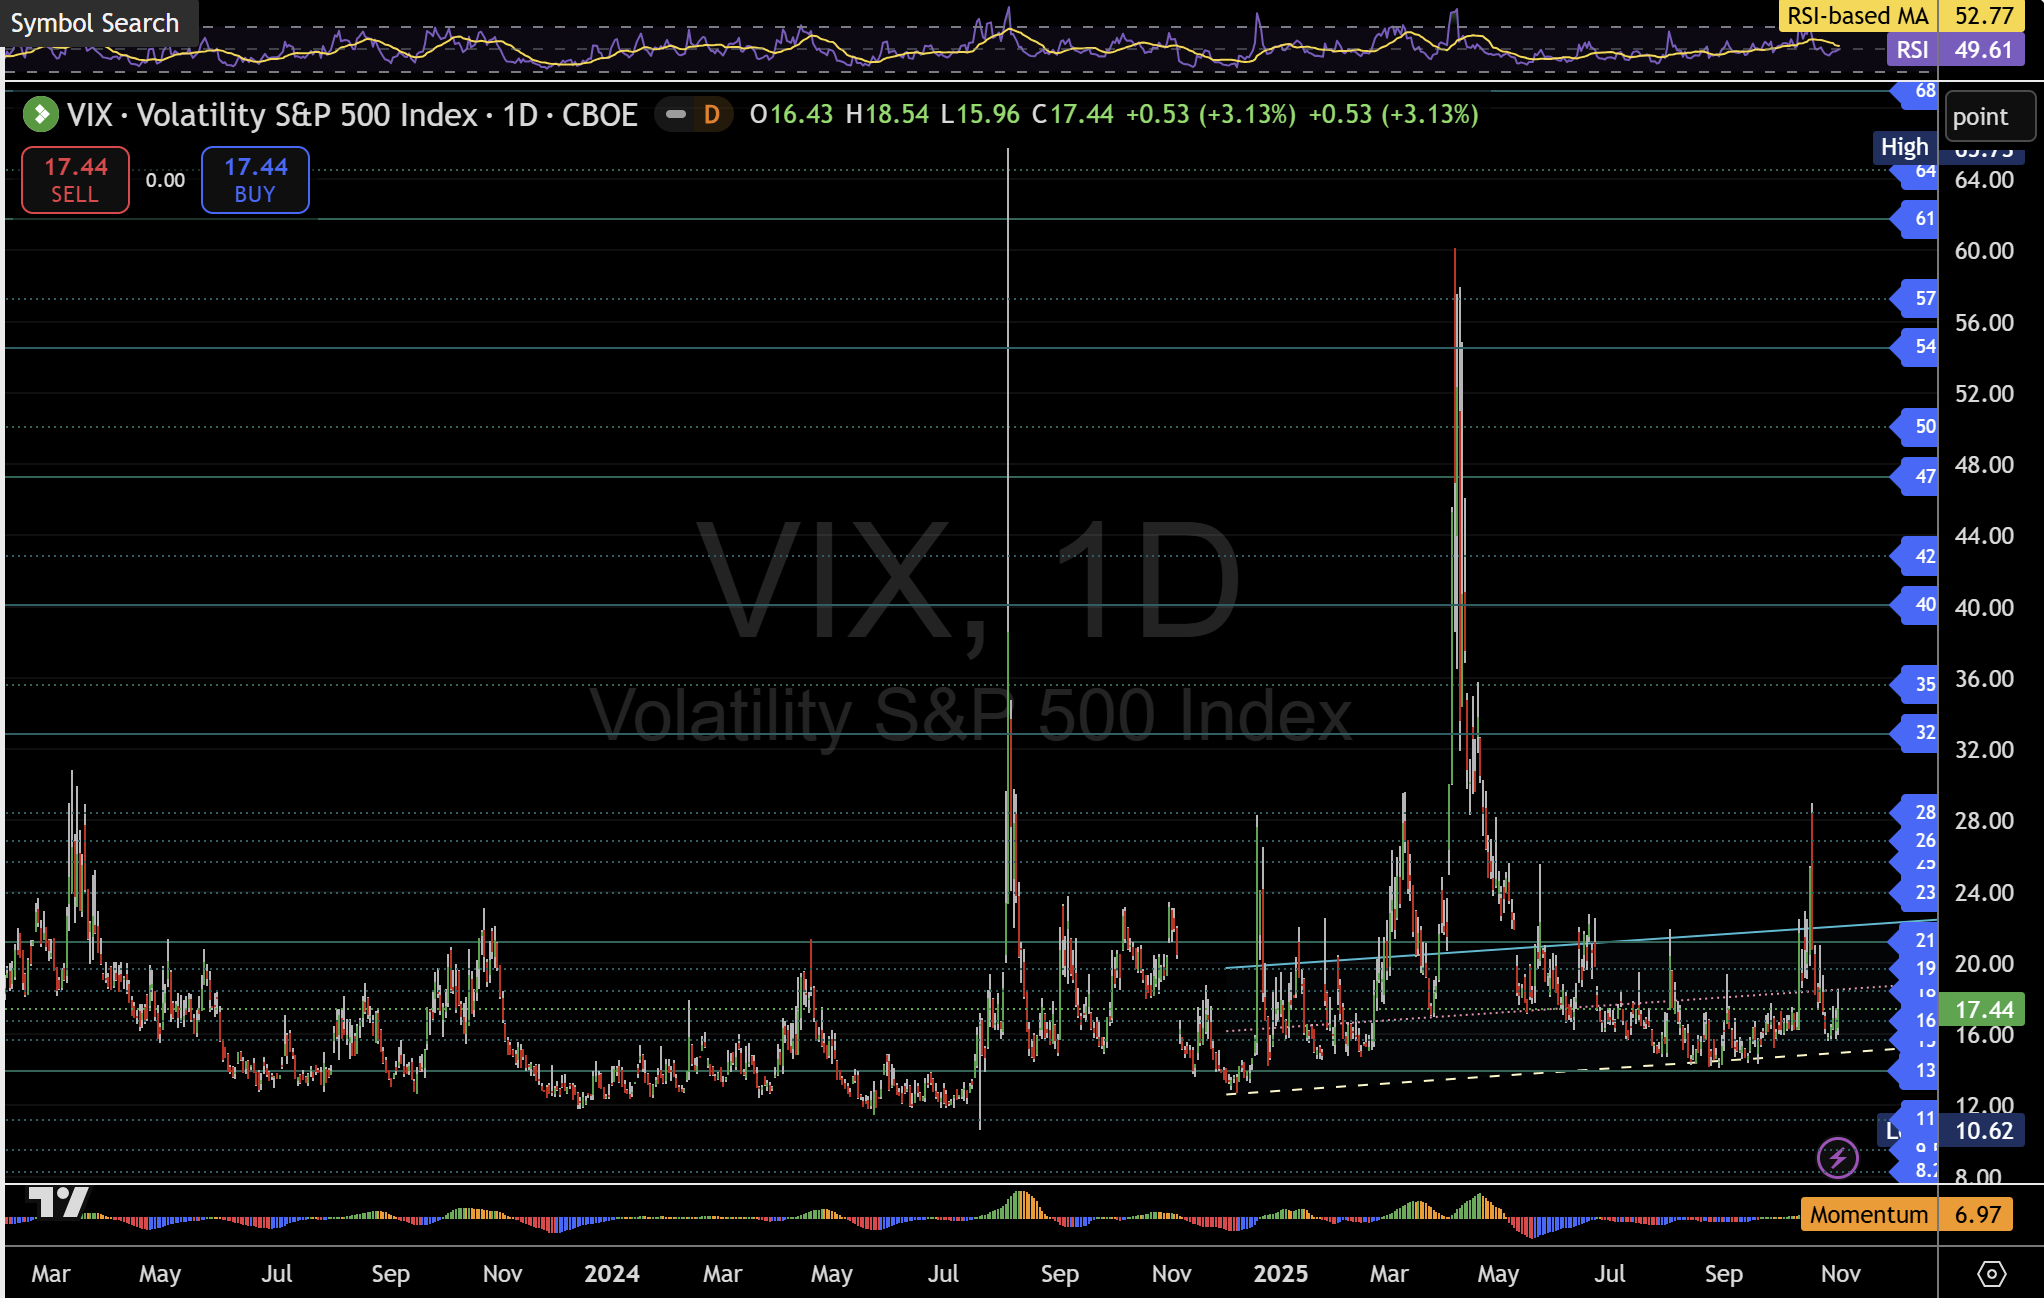
The Volatility Index steadies between 13.96 and 15.66; a breakout above 21 could confirm a shift in sentiment toward risk aversion.
Macro alignment: when technicals meet fundamentals
From a macro perspective, the signals align:
- Sticky inflation continues to challenge the Federal Reserve's 2% target.
- Real yields remain near multi-decade highs, constraining valuation expansion.
- Fiscal pressure from rising debt issuance is tightening liquidity.
- Corporate margins are narrowing as input and labour costs climb.
- Geopolitical uncertainty persists, elevating risk premiums across global markets.
These dynamics, combined with technical exhaustion in equities, a potential Gold reversal, and volatility basing, form a coherent narrative of a late-cycle transition. Historically, such alignment precedes not a crash but a rebalancing—a broad repricing of risk across asset classes.
Summary: The divergence that demands attention
The simultaneous rise of Gold and the firming VIX, against record levels in the Nasdaq and S&P 500, paints a clear message: the market's rhythm is changing. While optimism dominates headlines, structure and sentiment tell a subtler story—one of fading momentum, rising hedging activity, and early capital rotation.
A controlled correction of 15–30% in equities would not mark the end of the bull era but rather the transition to its next phase—one defined by selectivity, discipline, and the reawakening of volatility.
For those studying both structure and macro, this is the moment to pay attention. As history has shown, divergence is rarely random—it's often the market's first whisper before the next chapter begins.
Author

Denis Joeli Fatiaki
Independent Analyst
Denis Joeli Fatiaki possesses over a decade of extensive experience as a multi-asset trader and Market Strategist.