Enjin Coin Price Forecast: ENJ extends rally as volume and open interest hit multi-month highs
- Enjin Coin price extends its rally on Thursday after rallying nearly 40% the previous day.
- On-chain and derivatives data back up bullish sentiment, with trading volume and open interest hitting multi-month highs.
- The technical outlook suggests further gains as bulls are in control of the momentum.

Enjin Coin (ENJ) price extends its gains, trading above $0.035 on Thursday after a sharp 40% rally on the previous day. The bullish price action is supported by on-chain and derivatives data, with a constructive technical outlook suggesting further gains for ENJ in the coming days.
Enjin Coin’s trading volume and open interest signal bullish bias
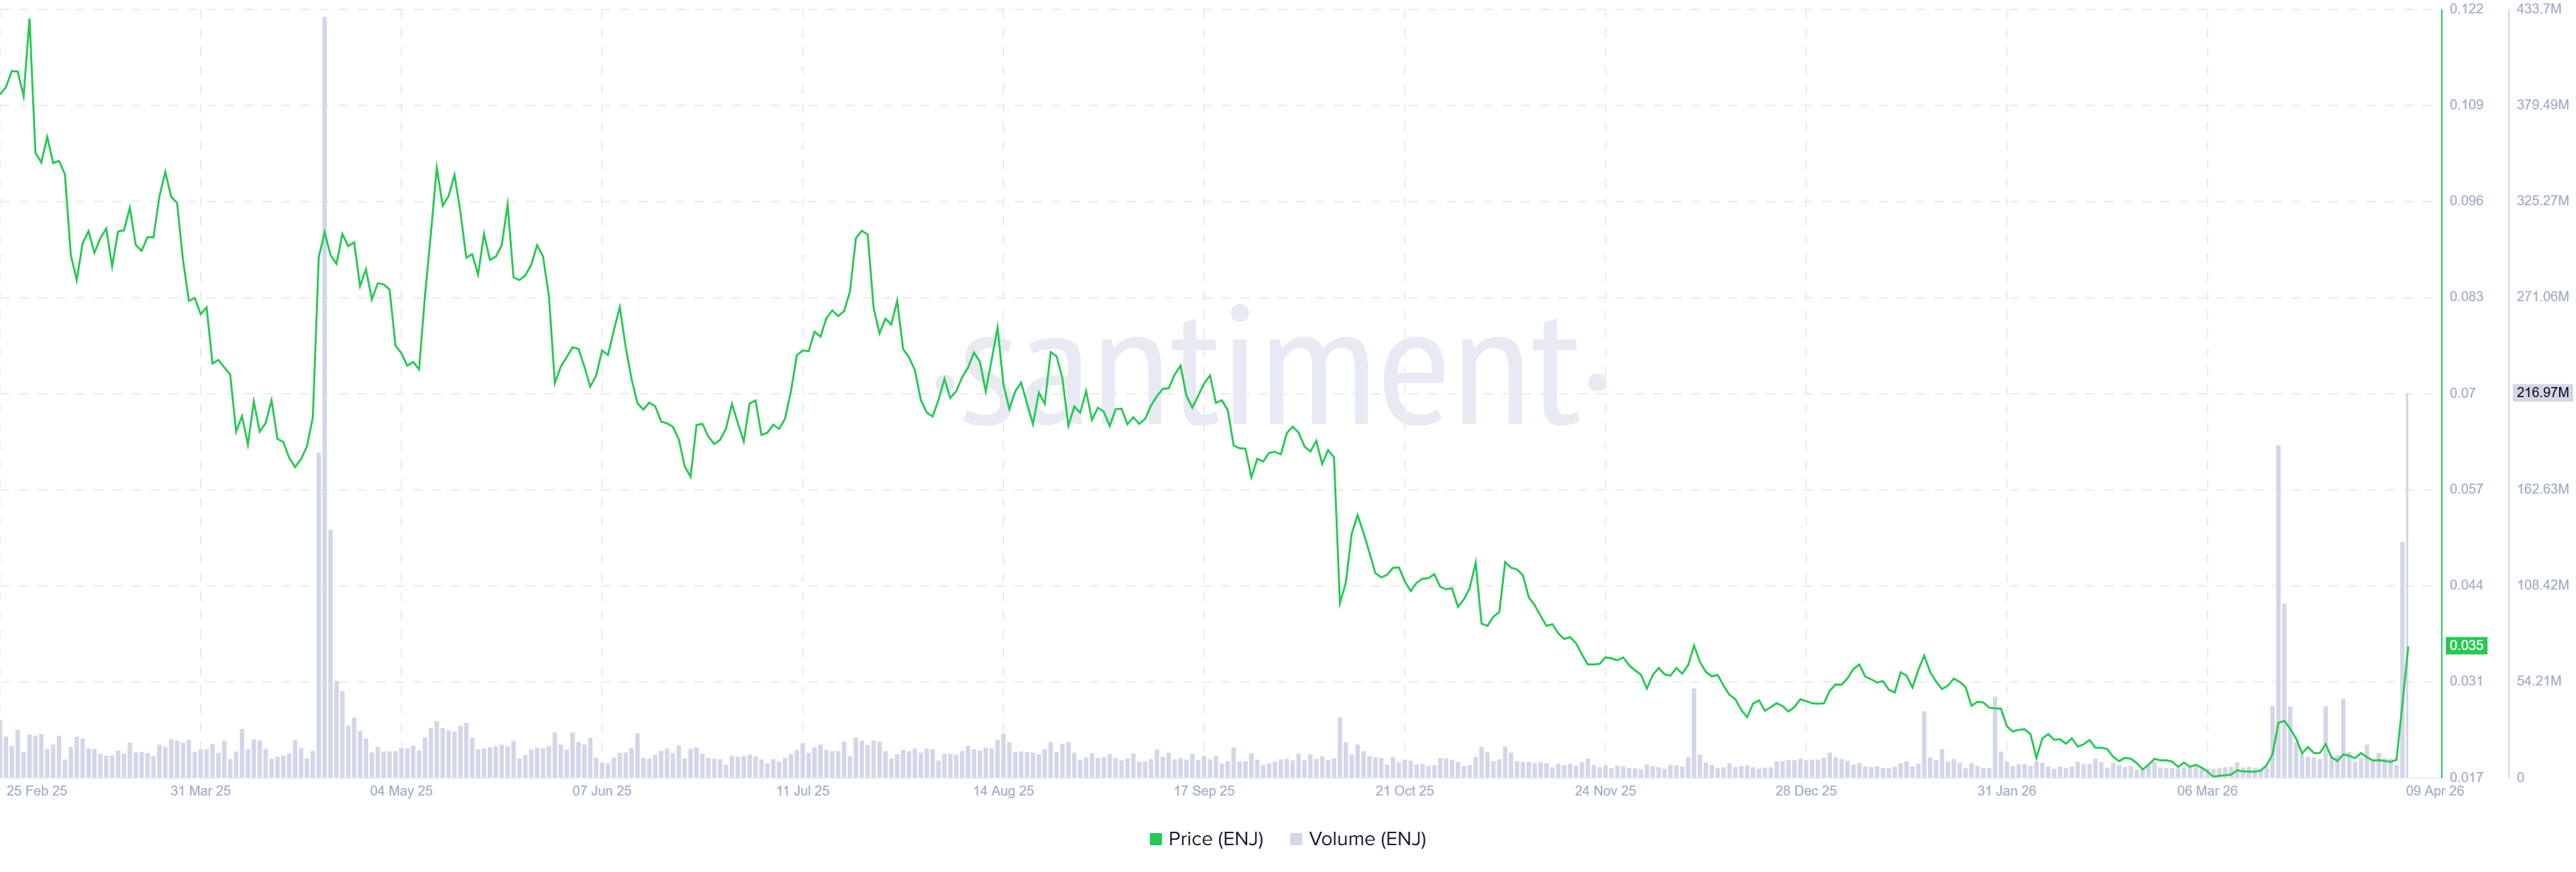
Santiment data shows that Enjin Coin ecosystem’s trading volume (the aggregate trading volume generated by all exchange applications on the chain) reached $216.97 million on Thursday, the highest trading volume not seen since April 2025. This volume rise indicates a surge in traders’ interest and liquidity in ENJ, boosting its bullish outlook.
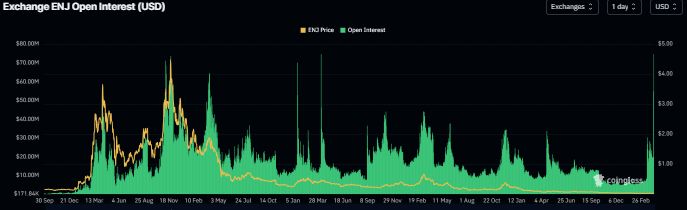
CoinGlass data shows that the futures’ Open Interest (OI) at exchanges in Enjin Coin reached a record high of $74.68 million on Thursday, up from $19.82 million on Tuesday. An increasing OI indicates new or additional money entering the market and new buying, which could fuel a rally in ENJ price.
Some signs of concern
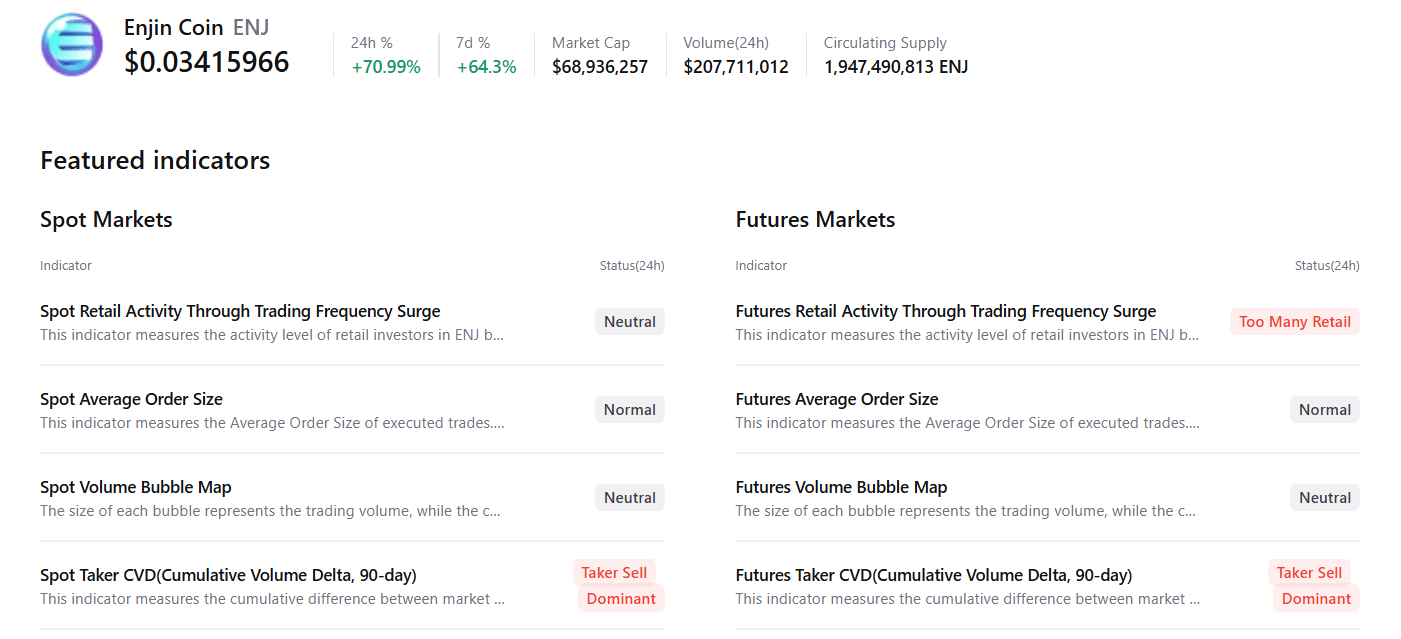
Despite the bullish outlook, traders should be cautious, as early signs of buyer exhaustion have emerged in Enjin Coin. CryptoQuant’s summary data indicates that futures market data suggests rising retail activity, reflecting negative sentiment. In addition, sell-side dominance in spot and futures markets further supports a bearish outlook for ENJ.
Enjin Coin Price Forecast: ENJ surges over 26%
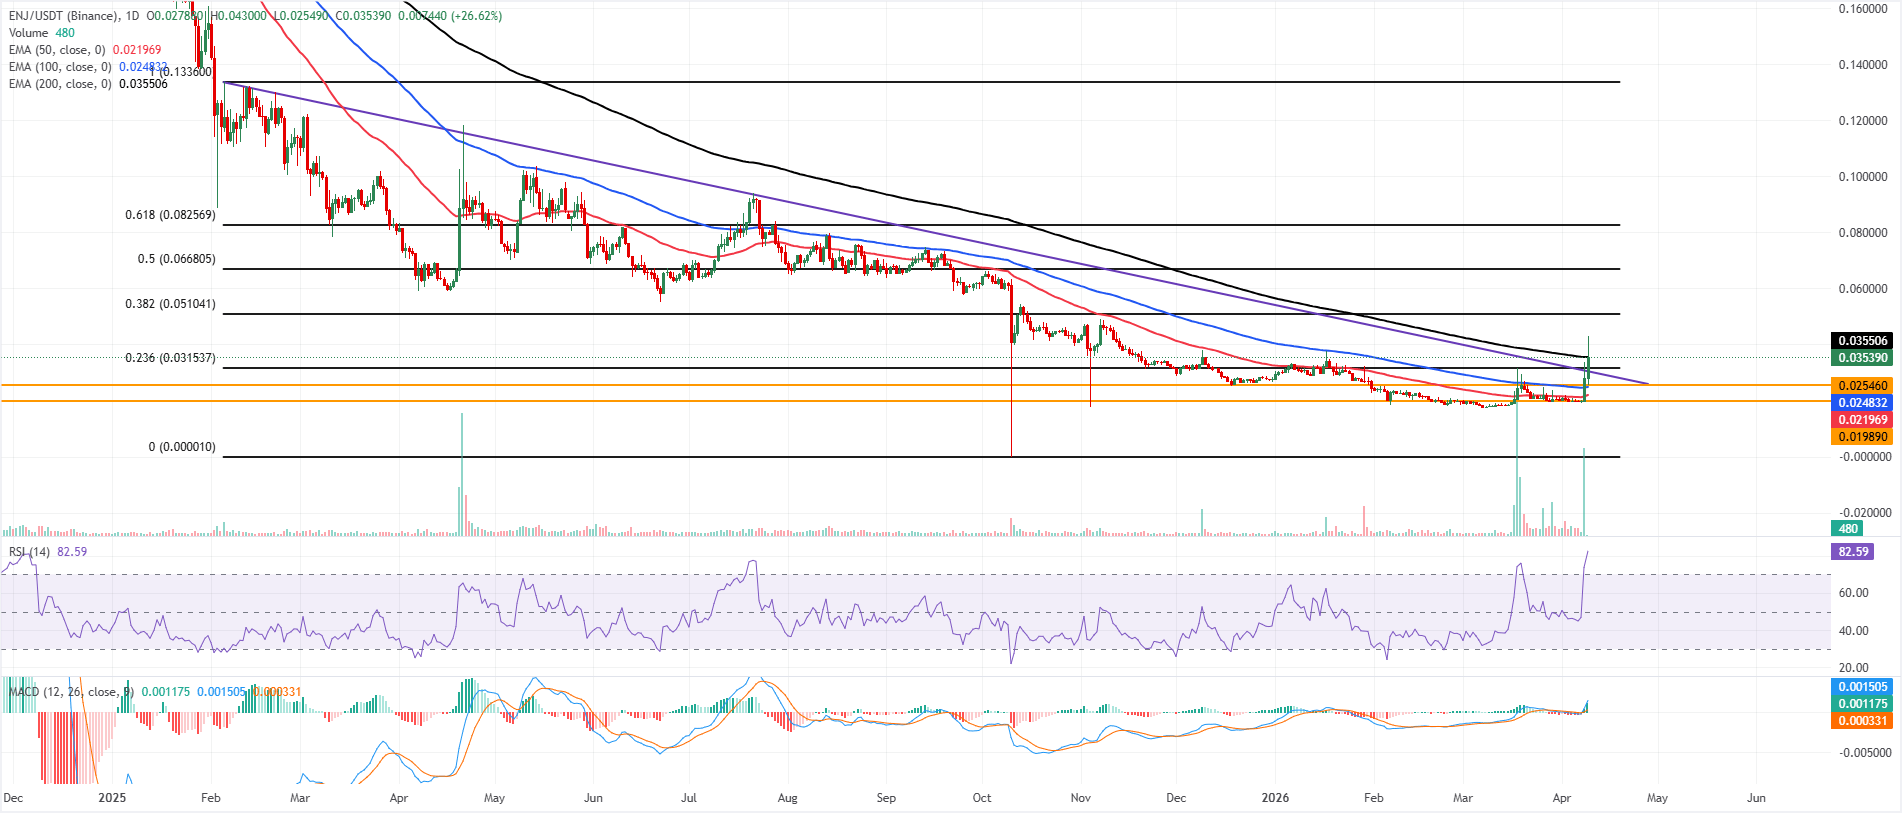
Enjin Coin price is up by 26%, trading above $0.035 on Thursday after surging by barely 40% the previous day. This sharp rally has lifted ENJ price back above the short- and medium-term Exponential Moving Averages (EMA), leaving only the 200-day EMA at $0.035 as immediate overhead resistance.
Breaking through the 23.6% Fibonacci retracement at $0.031 and the nearby EMAs cluster tilt the near-term bias to bullish, while the Relative Strength Index (RSI) on the daily chart around 82 signals overbought conditions that could slow the advance but not yet negate the constructive tone, as long as price holds above reclaimed structural levels. The Moving Average Convergence Divergence (MACD) histogram turning strongly positive reinforces growing upside momentum.
On the topside, initial resistance is seen at the 200-day EMA at $0.035; a sustained daily close above this barrier would open the way toward higher Fibonacci retracement levels, with the 38.2% retracement at $0.051 the next notable target, followed by $0.066 and $0.082.
On the downside, the 23.6% Fibonacci level at $0.031 offers first support ahead of the horizontal floor at $0.025, while the 100-day EMA at $0.024 and the 50-day EMA at $0.022, together with the lower horizontal level at $0.019, form a deeper demand zone that would need to give way to suggest that the current bullish phase has failed.
(The technical analysis of this story was written with the help of an AI tool.)
Author

Manish Chhetri
FXStreet
Manish Chhetri is a crypto specialist with over four years of experience in the cryptocurrency industry.