Enjin Coin Price Forecast: ENJ extends rally after 90% surge as overheating risks emerge
- Enjin Coin price extends its gains on Tuesday after rallying over 90% the previous week.
- Rising open interest, alongside increasing trading volume, suggests growing interest among traders.
- Market participants should remain cautious as overheating and sell-side dominance could cap further upside.

Enjin Coin (ENJ) price extends its gains, trading above $0.045 on Tuesday after surging more than 90% in the previous week. Rising Open Interest (OI) and sharply increasing trading volume point to sustained demand, but traders should be cautious as signs of overheating and rising sell-side activity suggest the rally may face near-term resistance.
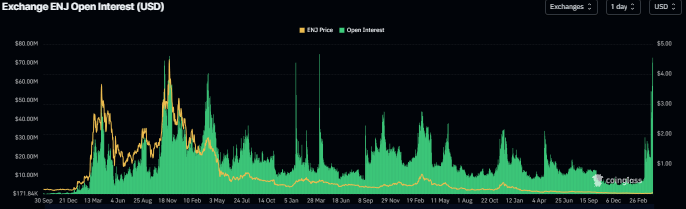
Surge in open interest, trading volume hints at bullish bias
CoinGlass data shows that the futures’ OI at exchanges for Enjin Coin rose sharply to $72.69 million on Tuesday, up from $19.64 million on April 7, reaching the highest level since mid-April 2023. An increasing OI indicates new or additional money entering the market and new buying, which could help maintain the rally in ENJ price.
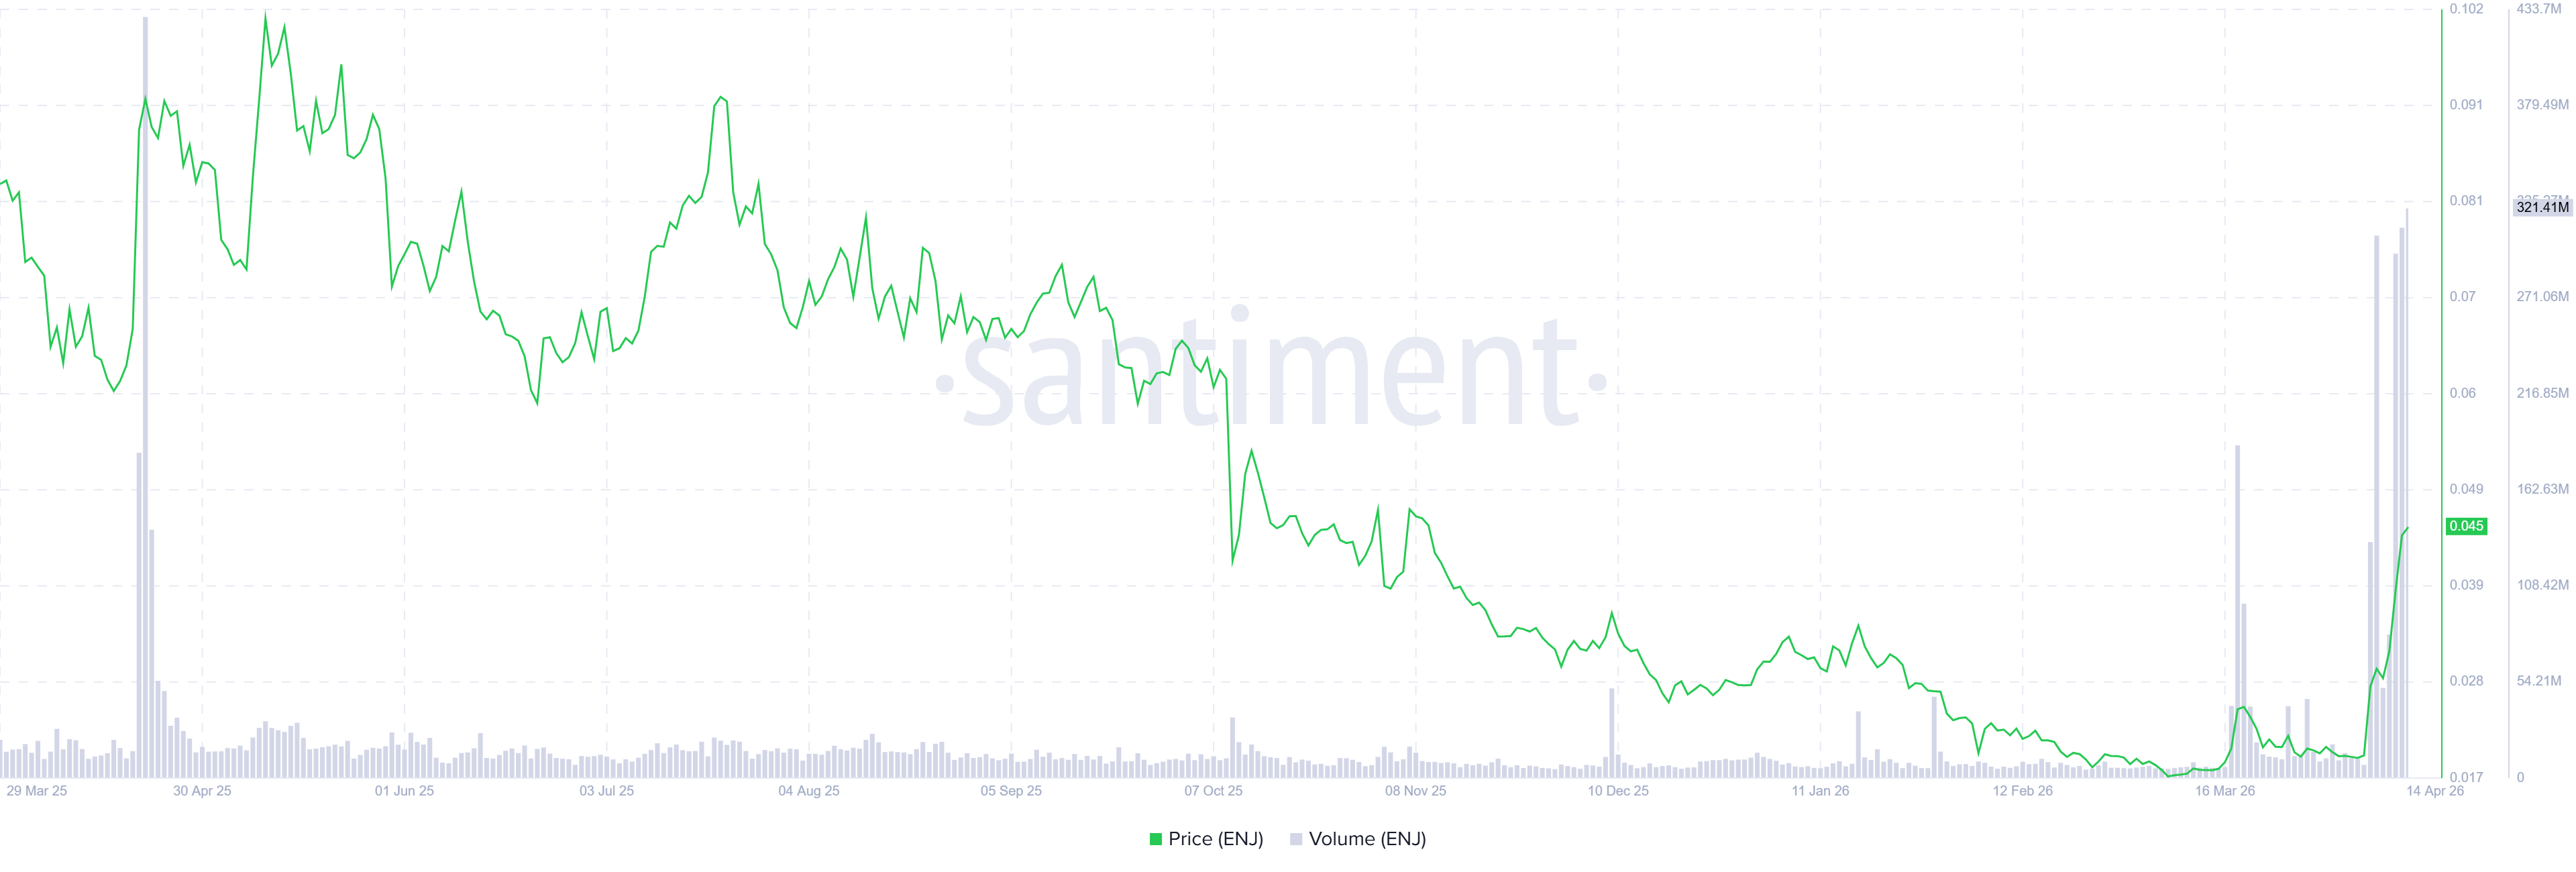
Santiment data shows that Enjin Coin ecosystem’s trading volume (the aggregate trading volume generated by all exchange applications on the chain) reached $321.41 million on Tuesday, the highest trading volume since April 2025. This volume rise indicates a surge in traders’ interest and liquidity in ENJ, boosting its bullish outlook.
Some signs of concerns
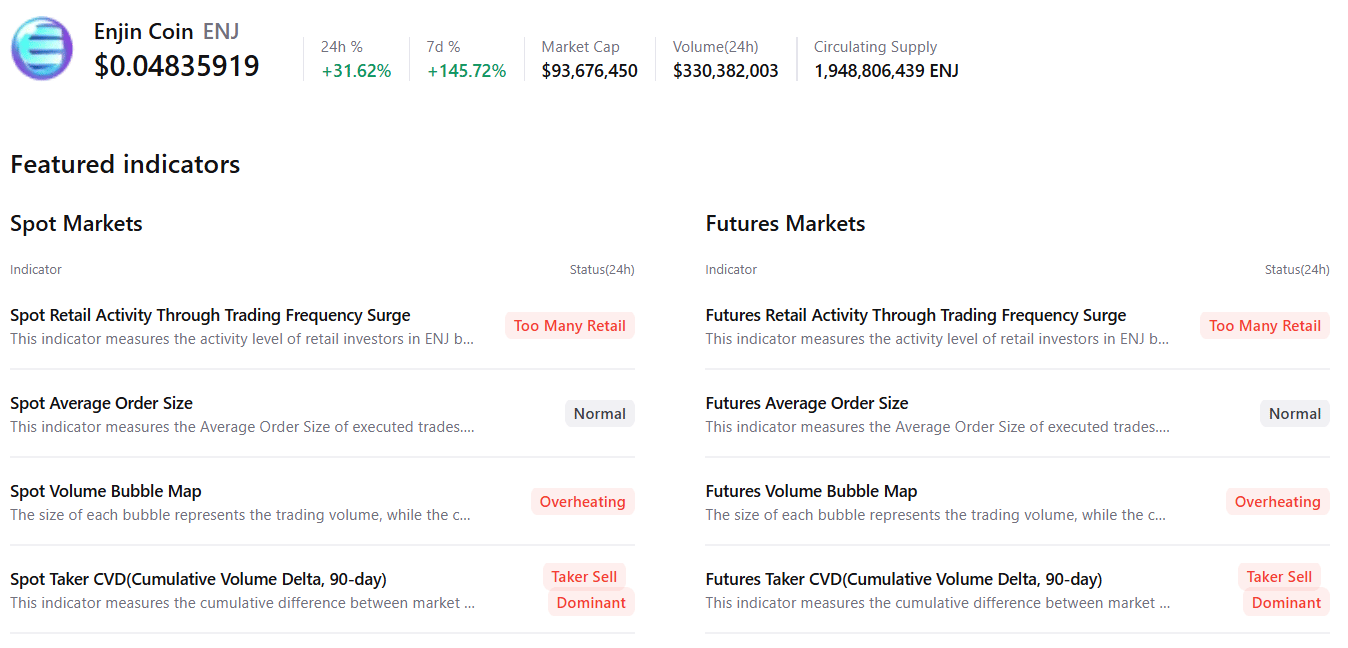
Despite the bullish outlook, market participants should be cautious as signs of buyer exhaustion have emerged. CryptoQuant’s summary data indicates that spot and futures market data suggest rising retail activity, overheating conditions and sell-side dominance, supporting a bearish outlook for ENJ.
Enjin Price Technical Analysis: Momentum indicators look stretched
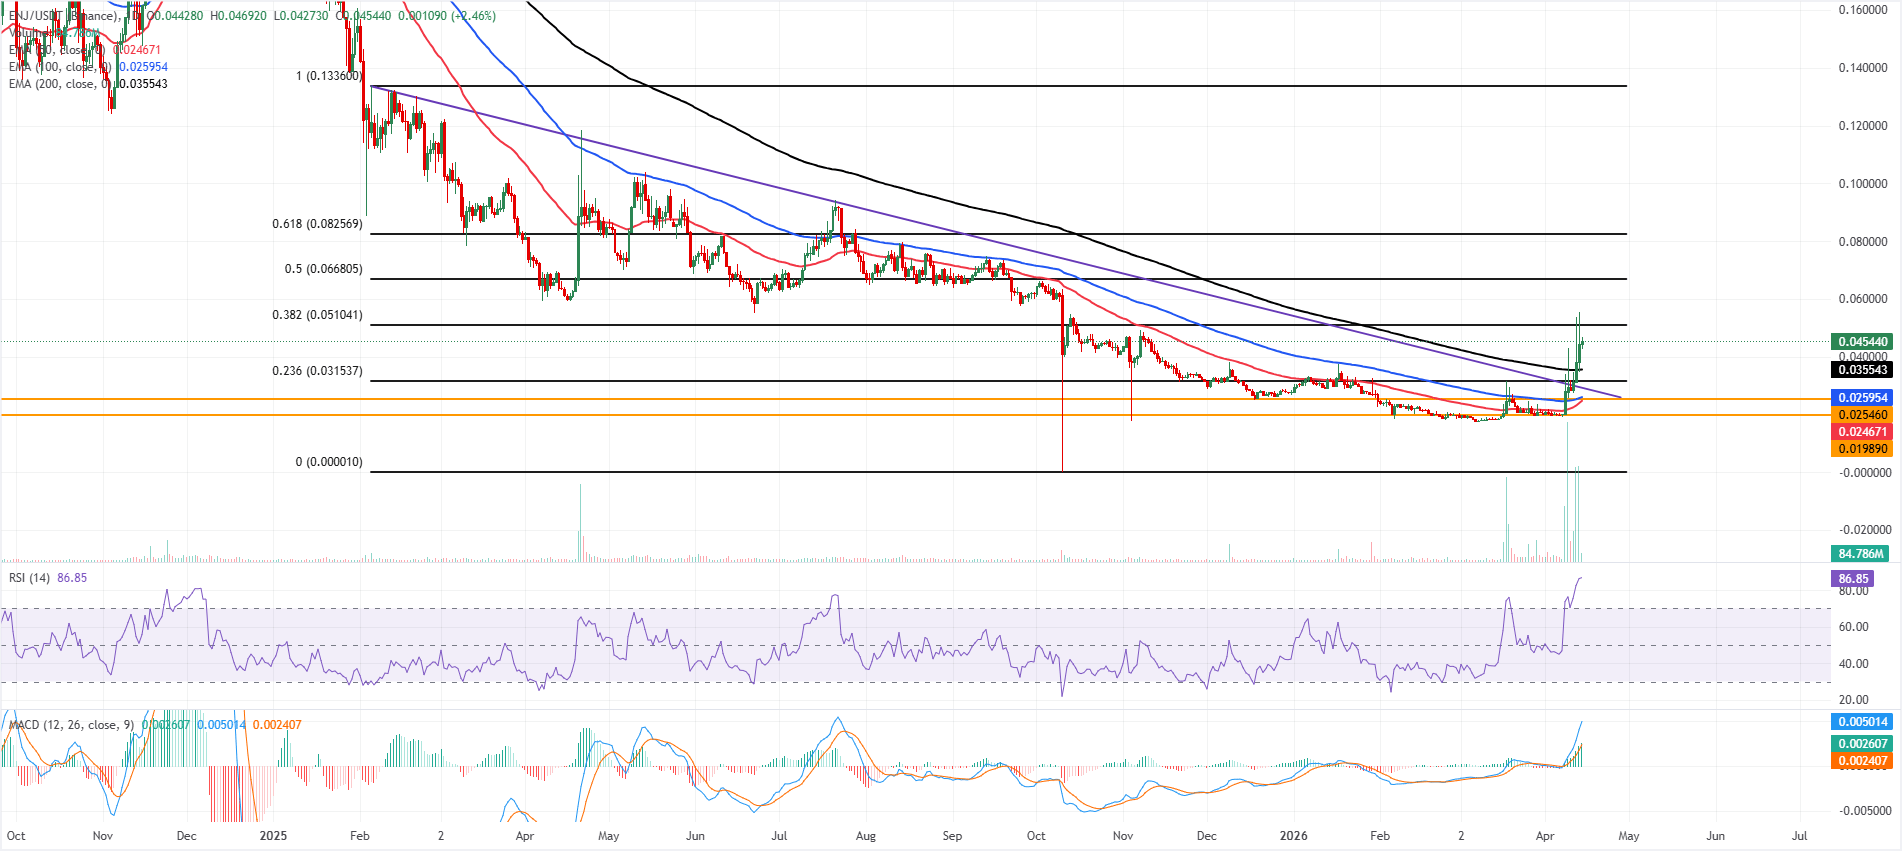
Enjin Coin price is trading above $0.045 on Tuesday after surging by over 16% the previous day. The token is extending a sharp rebound above its main Exponential Moving Averages (EMAs), which now underpin a clear bullish near-term bias. The 50-day, 100-day, and 200-day EMAs, clustered between roughly $0.024 and $0.035, sit well below the current trading level, suggesting a constructive backdrop after the recent breakout above the long-running descending trendline, whose break level lies around $0.029.
However, the momentum is stretched, with the Relative Strength Index (RSI) on the daily chart deep in overbought territory near 87 and the Moving Average Convergence Divergence (MACD) positive and rising, which reinforces the upside tone but also hints at the risk of a cooling phase.
On the topside, immediate resistance is located at the 38.2% Fibonacci retracement of the broader downswing (drawn from the February 5 high of $0.133 to the October 10 low of $0.00001) at $0.051, ahead of a more substantial barrier at the 50.0% retracement around $0.066.
On the downside, initial support is seen at the 200-day EMA near $0.035, with the 23.6% Fibonacci level at $0.031 and the former descending trendline break area at $0.029 offering additional demand on deeper pullbacks. Below there, the 100-day EMA at $0.026, horizontal support at $0.025 and the 50-day EMA at $0.024 guard a more distant floor around $0.019.
(The technical analysis of this story was written with the help of an AI tool.)
Author

Manish Chhetri
FXStreet
Manish Chhetri is a crypto specialist with over four years of experience in the cryptocurrency industry.