|

Elliott Wave intraday view on Russell 2000 (RTY) calling for index to resume higher

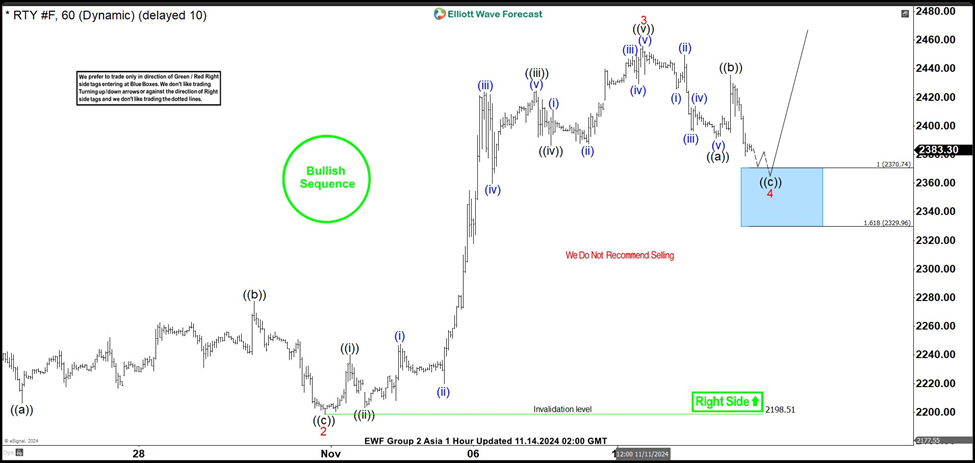
Short Term Elliott Wave view on Russell 2000 (RTY) suggests rally from 8.5.2024 low is in progress as a 5 waves impulse. Up from 8.5.2024 low, wave 1 ended at 2311.4 and pullback in wave 2 ended at 2198.51 like the 1 hour chart below shows. The Index then extends higher in wave 3 with internal subdivision as an impulse. Up from wave 2, wave ((i)) ended at 2240 and dips in wave ((ii)) ended at 2203.3. Rally in wave ((iii)) higher ended at 2424.5 and pullback in wave ((iv)) ended at 2386.5. Final leg wave ((v)) ended at 2455.6 which completed wave 3 in higher degree.

Wave 4 pullback is in progress with internal subdivision as a zigzag Elliott Wave structure. Down from wave 3, wave (i) ended at 2425.9 and wave (ii) rally ended at 2449.7. Wave (iii) lower ended at 2396.3 and wave (iv) rally ended at 2413.8. Final leg wave (v) ended at 2391.4 which completed wave ((a)) in higher degree. Rally in wave ((b)) ended at 2435.6. Expect wave ((c)) lower to end at 2330 – 2370 area to complete wave 4 in higher degree. From there, the Index can then see further upside or rally in 3 waves at least.

Russell 2000 (RTY) 60 minutes Elliott Wave chart

RTY

RTY_F Elliott Wave [Video]

Author

Elliott Wave Forecast Team

Elliott Wave Forecast Team

ElliottWave-Forecast.com

More from Elliott Wave Forecast Team
Share:

Editor's Picks

EUR/USD consolidates above 1.1800 as trades await Eurozone CPI and US data

The EUR/USD pair struggles to capitalize on the previous day's modest bounce from the 1.1780-1.1775 area, or over a one-week low, and oscillates in a narrow band during the Asian session on Wednesday. Spot prices currently trade around the 1.1815 zone, nearly unchanged for the day, as traders keenly await the release of the flash Eurozone consumer inflation figures.

GBP/USD consolidates ahead of Bank of England rate decision

The Pound Sterling traded in a narrow range against the US Dollar on Tuesday, edging modestly higher to near 1.3700 as markets adopted a cautious stance ahead of the Bank of England's first policy decision of 2026. GBP/USD opened the session at 1.3665 and touched an intraday high near 1.3707, with the pair consolidating below the multi-year high of 1.3869 posted in late January.

Gold extends recovery toward $5,050 as US-Iran tensions boost haven demand

Gold price builds on the previous recovery toward $5,050 in the Asian session on Wednesday. The precious metal extends the rebound after a historic and volatile sell-off last week. Traders weigh the next round of US economic signals amid a resurgent demand for safe-haven assets and renewed US-Iran geopolitical tensions.

Why is the crypto market crashing?

Bitcoin and the broader crypto market are experiencing a heavy downturn on Tuesday amid negative sentiment following the latest tech earnings. The top crypto briefly declined more than 5% over the past 24 hours, sliding below $73,500 before quickly recovering above $75,000 at the time of publication. Over the past two weeks, Bitcoin has lost more than 23%, eroding about $401 billion in market capitalization.

Gold and silver recovery continues, but equities sink as tech is shunned

The risk recovery is on pause as we move through Tuesday. After signs that a recovery in precious metals could boost overall risk appetite earlier today, a nasty sell off in tech stocks has pushed the Nasdaq and the S&P 500 down by 1.7% and 1.1% respectively.

Ripple slides as low retail, institutional demand weigh

Ripple edges lower, trading marginally below $1.60 at the time of writing on Tuesday as bulls and bears battle for control. The cross-border remittance token rose to $1.66 on Monday, but profit-taking and risk-off sentiment in the broader crypto market led to the ongoing correction.