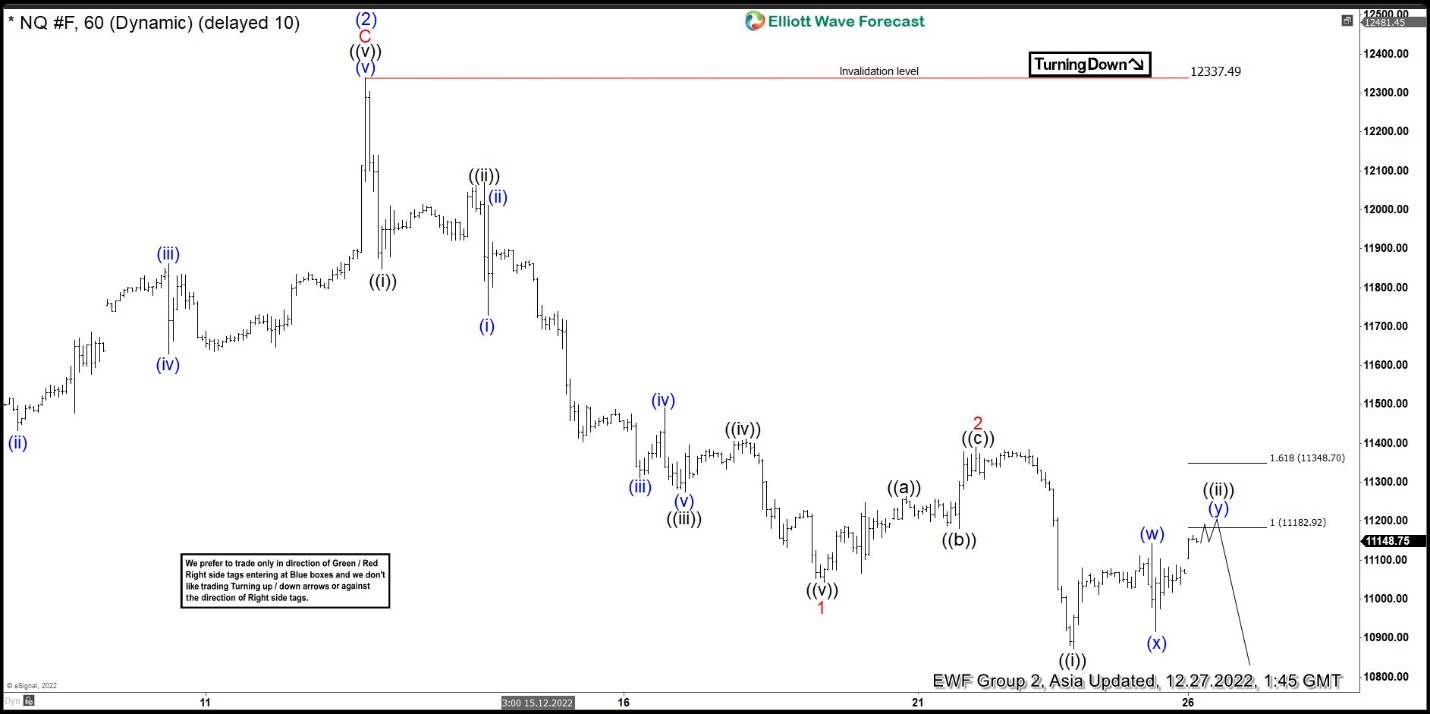
Short term, Elliott wave view in Nasdaq (NQ) suggests that the decline from 8.16.2022 high is unfolding as a 5 waves impulse Elliott Wave structure. Down from 8.16.2022 high, wave (1) ended at 10890.75 and rally in wave (2) ended at 12339. Internal subdivision of wave (2) unfolded as an expanded Flat structure where wave A ended at 11729.75 and pullback in wave B ended at 10484.75. Final leg wave C ended at 12337.49 which completed wave (2). Index then resumes lower from there in wave (3). Down from wave (2), wave ((i)) ended at 11847 and rally in wave ((ii)) ended at 12069.50. Index resumes lower in wave ((iii)) towards 11275, wave ((iv)) ended at 11411, and final leg lower wave ((v)) ended at 11043.50. This completed wave 1 in higher degree.
Wave 2 corrective rally ended at 11389.75 with internal subdivision as a zigzag structure. Up from wave 1, wave ((a)) ended at 11263.75 and pullback in wave ((b)) ended at 11181. Final leg higher wave ((c)) ended at 11389.75 which completed wave 2. The Index resumes lower in wave 3 with internal subdivision as another impulse. Down from wave 2, wave ((i)) ended at 10870.50. As far as rally fails below wave 2 at 11389.75 and more importantly below wave (2) high at 12337.49, expect the Index to extend lower.
Nasdaq 60 minutes Elliott Wave chart
NQ Elliott Wave video
FURTHER DISCLOSURES AND DISCLAIMER CONCERNING RISK, RESPONSIBILITY AND LIABILITY Trading in the Foreign Exchange market is a challenging opportunity where above average returns are available for educated and experienced investors who are willing to take above average risk. However, before deciding to participate in Foreign Exchange (FX) trading, you should carefully consider your investment objectives, level of xperience and risk appetite. Do not invest or trade capital you cannot afford to lose. EME PROCESSING AND CONSULTING, LLC, THEIR REPRESENTATIVES, AND ANYONE WORKING FOR OR WITHIN WWW.ELLIOTTWAVE- FORECAST.COM is not responsible for any loss from any form of distributed advice, signal, analysis, or content. Again, we fully DISCLOSE to the Subscriber base that the Service as a whole, the individual Parties, Representatives, or owners shall not be liable to any and all Subscribers for any losses or damages as a result of any action taken by the Subscriber from any trade idea or signal posted on the website(s) distributed through any form of social-media, email, the website, and/or any other electronic, written, verbal, or future form of communication . All analysis, trading signals, trading recommendations, all charts, communicated interpretations of the wave counts, and all content from any media form produced by www.Elliottwave-forecast.com and/or the Representatives are solely the opinions and best efforts of the respective author(s). In general Forex instruments are highly leveraged, and traders can lose some or all of their initial margin funds. All content provided by www.Elliottwave-forecast.com is expressed in good faith and is intended to help Subscribers succeed in the marketplace, but it is never guaranteed. There is no “holy grail” to trading or forecasting the market and we are wrong sometimes like everyone else. Please understand and accept the risk involved when making any trading and/or investment decision. UNDERSTAND that all the content we provide is protected through copyright of EME PROCESSING AND CONSULTING, LLC. It is illegal to disseminate in any form of communication any part or all of our proprietary information without specific authorization. UNDERSTAND that you also agree to not allow persons that are not PAID SUBSCRIBERS to view any of the content not released publicly. IF YOU ARE FOUND TO BE IN VIOLATION OF THESE RESTRICTIONS you or your firm (as the Subscriber) will be charged fully with no discount for one year subscription to our Premium Plus Plan at $1,799.88 for EACH person or firm who received any of our content illegally through the respected intermediary’s (Subscriber in violation of terms) channel(s) of communication.
Recommended content
Editors’ Picks
EUR/USD stays below 1.0900 as Q1 comes to an end

EUR/USD has lost its traction and declined below 1.0900 in the American session on Friday. Quarter-end flows seem to be allowing the US Dollar find some demand but the risk-positive market environment seems to be limiting the pair's downside ahead of the weekend.
GBP/USD trades below 1.2400, looks to post weekly gains

GBP/USD has edged lower after having tested 1.2400 earlier in the day but remains on track to end the third straight week in positive territory. The upbeat mood remains intact after soft PCE inflation data from the US, making it difficult for the US Dollar to continue to gather strength.
Gold tries to stabilize near $1,980 following earlier spike

Gold price has returned to the $1,980 area following a spike above $1,987 with the initial reaction to lower-than-expected PCE inflation figures from the US. Meanwhile, the benchmark 10-year US Treasury bond yield stays in the red near 3.5%, providing support to XAU/USD.
Will Dogecoin price pull an XRP and rally 60% next week?

Dogecoin price has been in a tight range bound movement since November 22. The recent recovery above the range low looks promising and hints at an explosive move for next week.
Week ahead – Nonfarm payrolls to set the tone for US dollar

With the banking turmoil receding, market participants will turn their attention back to economic releases. The spotlight will fall on the US employment report.