|

Elliott Wave analysis: Tesla (TSLA) sustains strong upward rally [Video]

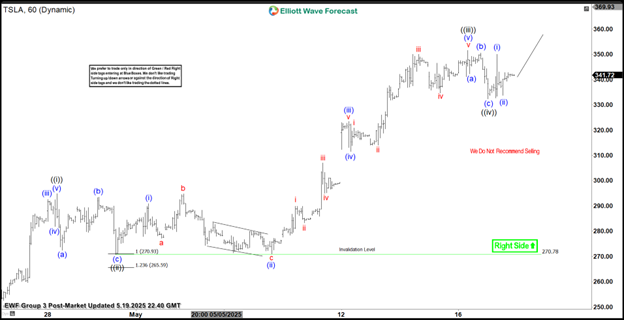
The current price cycle for Tesla (TSLA), starting from its low on April 22, 2025, is unfolding as a five-wave impulse structure, a common pattern in technical analysis signaling strong directional momentum. As illustrated on the 1-hour chart, the stock has been advancing since this low, with distinct waves forming within the broader structure.

From the April 22 low, the first wave, labeled ((i)), peaked at $294.85, followed by a corrective pullback in wave ((ii)) that found support at $270.78. The stock then surged higher in wave ((iii)), demonstrating robust bullish momentum. Within this wave, the internal structure unfolded as follows: wave (i) reached $290.87, followed by a pullback in wave (ii) to $271. The rally resumed in wave (iii), pushing the price to $323.48, before a minor correction in wave (iv) concluded at $311.50. The final leg, wave (v), culminated at $351.52, completing wave ((iii)) of the broader impulse.

Subsequently, a corrective wave ((iv)) unfolded as a zigzag pattern. From the wave ((iii)) peak, wave (a) declined to $342.33, followed by a wave (b) rally to $350.56. The corrective move concluded with wave (c) at $332.29, marking the end of wave ((iv)).

Looking ahead, as long as the price remains above the key support level of $270.78, any near-term pullbacks are likely to attract buyers in a 3, 7, or 11-swing corrective pattern, setting the stage for further upside in the ongoing impulse structure.

Tesla (TSLA) 60-minute Elliott Wave technical chart

TSLA

TSLA Elliott Wave technical [Video]

Author

Elliott Wave Forecast Team

Elliott Wave Forecast Team

ElliottWave-Forecast.com

More from Elliott Wave Forecast Team
Share:

Markets move fast. We move first.

Orange Juice Newsletter brings you expert driven insights - not headlines. Every day on your inbox.

By subscribing you agree to our Terms and conditions.

Editor's Picks

EUR/USD holds steady near 1.1750 on first trading day of 2026

EUR/USD stays calm on Friday and trades in a narrow channel at around 1.1750 as trading conditions remain thin following the New Year holiday and ahead of the weekend. The economic calendar will not feature any high-impact data releases.

GBP/USD struggles to gain traction, stabilizes above 1.3450

After testing 1.3400 on the last day of 2025, GBP/USD managed to stage a rebound. Nevertheless, the pair finds it difficult to gather momentum and moves sideways above 1.3450 as market participants remain in holiday mood.

Gold climbs toward $4,400 following deep correction

Gold reverses its direction and advances toward $4,400 after suffering heavy losses amid profit-taking before the New Year holiday. Growing expectations for a dovish Fed policy and persistent geopolitical risks seem to be helping XAU/USD stretch higher.

Cardano gains early New Year momentum, bulls target falling wedge breakout

Cardano kicks off the New Year on a positive note and is extending gains, trading above $0.36 at the time of writing on Friday. Improving on-chain and derivatives data point to growing bullish interest, while the technical outlook keeps an upside breakout in focus.

Economic outlook 2026-2027 in advanced countries: Solidity test

After a year marked by global economic resilience and ending on a note of optimism, 2026 looks promising and could be a year of solid economic performance. In our baseline scenario, we expect most of the supportive factors at work in 2025 to continue to play a role in 2026.

Crypto market outlook for 2026

Year 2025 was volatile, as crypto often is.  Among positive catalysts were favourable regulatory changes in the U.S., rise of Digital Asset Treasuries (DAT), adoption of AI and tokenization of Real-World-Assets (RWA).