|

DXY fails to hold momentum, declines near 106.00

  • DXY initially rose to 106.60 and then settled near 106.05.
  • Fed’s Logan words contributed to a significant increase in US bond yields.
  • Focus shifts to FOMC minutes on Wednesday and Thursday’s inflation figures from the US.

In Monday’s session, the DXY index declined for a fourth consecutive day towards the 106.05 area after rising to a daily high of 106.60 earlier in the session. In line with that, the index continues consolidating the gains, which took it to a multi-month high of 107.35 last week, driven by high US Treasury yields and expectations of a more aggressive Federal Reserve (Fed).

Data-wise, investors are still assessing last Friday’s Nonfarm Payroll report, which saw job creation accelerating in September as well as the unemployment rate while wage inflation decelerated. Markets will now set their sight on Wednesday’s Federal Open Market Committee (FOMC) minutes of the September meeting and, on Thursday, the Consumer Price Index (CPI) figures from the US to continue modelling their expectations regarding the Fed’s next steps.

That being said, Lorie Logan from the Fed showed a dovish stance on Monday and stated that there may be “less need” for continuing hiking, which caused short-term US Treasury yields to decline to multi-week lows. In that sense, the US Dollar faced selling pressure, but hawkish clues on the FOMC minutes or hot inflation reading may reignite the Greenback’s momentum as the Fed has clearly stated that their stance is still data-dependant.

In addition, the escalation of the conflict between Israel and the Hamas terrorist group in the Middle East may boost demand for the USD as investors may take refuge in it.

DXY Levels to watch 

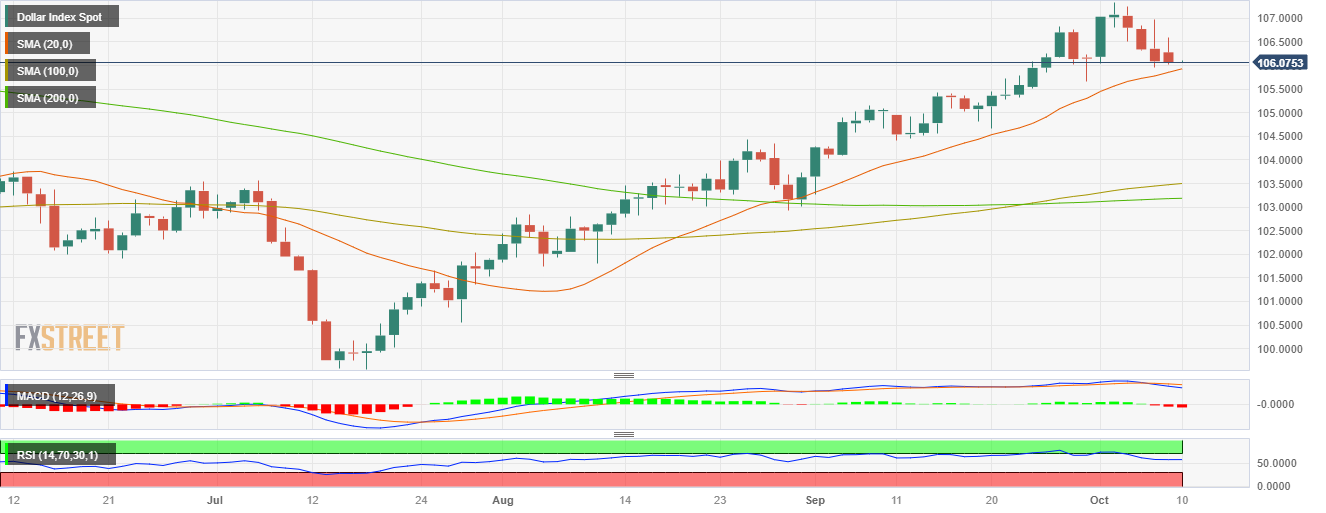
 The daily chart analysis indicates a neutral to a bearish outlook for DXY, as the bears show signs of taking control but still face challenges ahead. The Relative Strength Index (RSI) exhibits a negative slope above its midline, while the Moving Average Convergence (MACD) histogram lays out larger red bars. That said, the index is above the 20,100,200-day Simple Moving Average (SMA), indicating buyers command the broader perspective.

Support levels: 106.00, 105.85 (20-day SMA), 105.50.

Resistance levels: 106.30, 107.00, 107.30.

DXY Daily Chart

Dollar Index Spot

Overview
Today last price106.07
Today Daily Change-0.02
Today Daily Change %-0.02
Today daily open106.09
 
Trends
Daily SMA20105.78
Daily SMA50104.34
Daily SMA100103.45
Daily SMA200103.17
 
Levels
Previous Daily High106.98
Previous Daily Low105.95
Previous Weekly High107.35
Previous Weekly Low105.95
Previous Monthly High106.84
Previous Monthly Low103.27
Daily Fibonacci 38.2%106.34
Daily Fibonacci 61.8%106.59
Daily Pivot Point S1105.7
Daily Pivot Point S2105.31
Daily Pivot Point S3104.67
Daily Pivot Point R1106.73
Daily Pivot Point R2107.37
Daily Pivot Point R3107.76

Author

Patricio Martín

Patricio is an economist from Argentina passionate about global finance and understanding the daily movements of the markets.

More from Patricio Martín
Share:

Editor's Picks

AUD/USD stays bid above 0.7100 on Australian trade data, Mideast optimism

AUD/USD clings to minor recovery gains above 0.7100 in the Asian session on Thursday as a new Israel-Lebanon ceasefire keeps a lid on the safe-haven US Dollar. Meanwhile, strong AustralianTrade Balane data also help the Aussie pair sustain the bounce from weekly lows.

USD/JPY hovers near the 160.00 intervention threshold on Mideast tensions

USD/JPY struggles to find acceptance above 160.00 and retreats from a one-month high in the Asian session on Thursday amid fears that authorities will step in again to prop up the Japanese Yen. Furthermore, a new Israel-Lebanon ceasefire caps the US Dollar and supports the currency pair. However, renewed US-Iran tensions keep the downside limited in the Greenback and the pair.

Gold rebounds from one-week low as Israel-Lebanon truce pressures safe-haven USD

Gold gains some positive traction on Thursday and climbs to the $4,475 area during the Asian session, reversing a major part of the previous day's slide to a one-week low. The Israel-Lebanon truce prompts some profit-taking around the US Dollar and supports the commodity. 


Ethereum: Long-term holders' capitulation drives ETH below $1,800

Ethereum has fallen below $1,800 on Wednesday, the first time since May 2025 following accelerated spot selling pressure and distributions from long-term holders. The Age Consumed metric, which tracks the movement of previously idle tokens or long-term holders' coins, spiked over the past two days as prices declined, indicating increased selling activity among this cohort.

Kevin Warsh takes the Fed helm: What it means for the US Dollar
The Federal Reserve moves away from the highly predictable "forward guidance" model of the Jerome Powell era to a new “Kevin Warsh environment”, characterized by less communication, more policy surprises, and an increased focus on the Fed's complex balance sheet.
Recession on paper: What really moves the Canadian Loonie now?

Statistics Canada handed the headline writers a gift and the analysts a headache. Real GDP shrank 0.1% on an annualized basis in the first quarter, and with the fourth quarter of 2025 revised down to a 1.0% contraction, that is two negative quarters in a row, the textbook definition of a technical recession and Canada's first since the pandemic.