Dow Jones Industrial Average staunches the bleed, but upside remains limited
- The Dow Jones tested fresh lows on Tuesday but remained stuck near 43,500.
- Investor confidence was dealt a blow after consumer confidence slipped further.
- Signs of a widespread economic slowdown are growing, inflation figures still loom ahead.

The Dow Jones Industrial Average (DJIA) knocked slightly lower on Tuesday, dipping to a fresh multi-week low of 43,285. Investor sentiment recovered enough to push the Dow Jones back above the day’s opening bids near 43,600. Still, confidence remains shaky as signs of a deeper-than-expected economic slowdown encroach around the edges of the data.
US Conference Board consumer confidence survey results came in well below expectations on Tuesday, falling for a third straight month. The CB consumer sentiment index fell to 98.3 in February, far below the median forecast of 102.3, and is the largest single-month decline since Q3 2021. Consumers saw an overall improvement in current business conditions, but consumer expectations for future business conditions, income potential, and employment prospects declined.
Trade policy constraints remain a key concern for markets after US President Donald Trump reiterated his insistence that stiff tariff packages on goods imported from Mexico and Canada will be proceeding next week, as well as a wide swath of reciprocal tariffs on other US trading partners that include additional tariffs to offset other countries’ VAT and digital services taxes on their consumers. Investors still believe President Trump will continue to kick the can down the road and find excuses to pivot away from his tariffs in the eleventh hour. Still, the overarching threat of imposing steep importation taxes on US consumers already grappling with unsteady inflation factors bodes poorly for overall investor confidence.
Dow Jones news
Despite some shaky investor sentiment on Tuesday, the Dow Jones was tilted into the bullish side overall on the day. More of the index’s listed securities were in the green than not, and the worst-performing stock was Goldman Sachs (GS), which declined around 2% and fell to $613 per share. The Dow Jones’ weighting average means every dollar shed from a security’s headline price contributes to a 6.15-point decline.
On the high side, The Home Depot (HD) gained ground on Tuesday, rising around 4% and climbing to about $398 per share despite a gloomy homebuilding outlook.
Dow Jones price forecast
The Dow Jones is at risk of getting caught in another congestion pattern. The major equity index has been stuck below the 50-day Exponential Moving Average (EMA) at 43,908 for three trading sessions in a row, and bidders are running out of time to stage a fresh recovery to record highs above 45,000. As technical pressure gathers on the Dow Jones chart, a fresh backslide to the 200-day EMA rising into the 42,000 handle is looking more likely.
Dow Jones daily chart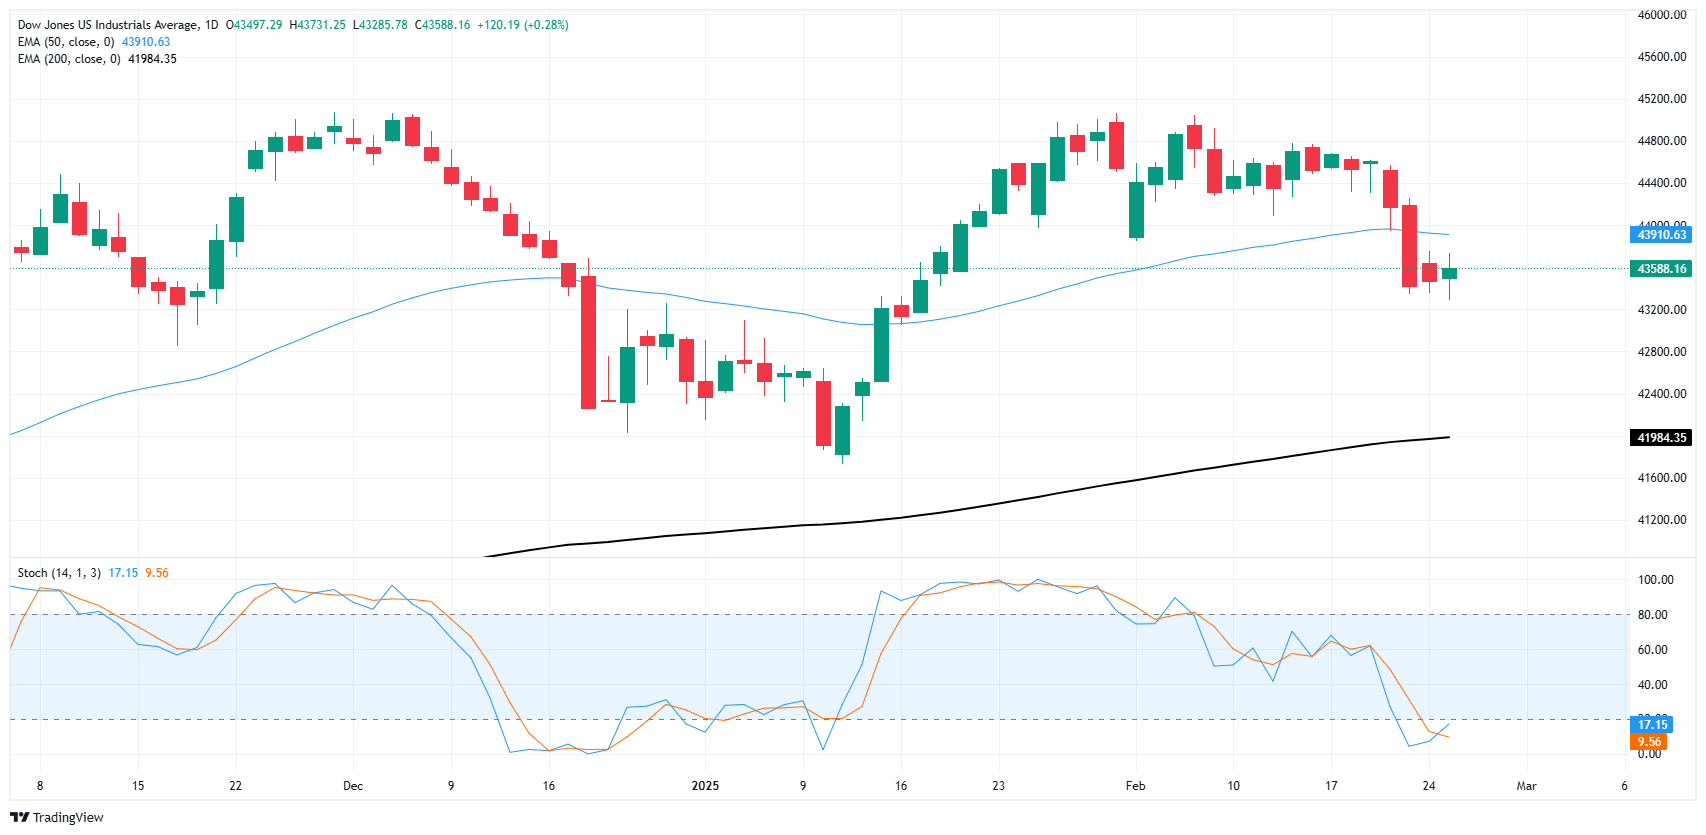
Dow Jones FAQs
The Dow Jones Industrial Average, one of the oldest stock market indices in the world, is compiled of the 30 most traded stocks in the US. The index is price-weighted rather than weighted by capitalization. It is calculated by summing the prices of the constituent stocks and dividing them by a factor, currently 0.152. The index was founded by Charles Dow, who also founded the Wall Street Journal. In later years it has been criticized for not being broadly representative enough because it only tracks 30 conglomerates, unlike broader indices such as the S&P 500.
Many different factors drive the Dow Jones Industrial Average (DJIA). The aggregate performance of the component companies revealed in quarterly company earnings reports is the main one. US and global macroeconomic data also contributes as it impacts on investor sentiment. The level of interest rates, set by the Federal Reserve (Fed), also influences the DJIA as it affects the cost of credit, on which many corporations are heavily reliant. Therefore, inflation can be a major driver as well as other metrics which impact the Fed decisions.
Dow Theory is a method for identifying the primary trend of the stock market developed by Charles Dow. A key step is to compare the direction of the Dow Jones Industrial Average (DJIA) and the Dow Jones Transportation Average (DJTA) and only follow trends where both are moving in the same direction. Volume is a confirmatory criteria. The theory uses elements of peak and trough analysis. Dow’s theory posits three trend phases: accumulation, when smart money starts buying or selling; public participation, when the wider public joins in; and distribution, when the smart money exits.
There are a number of ways to trade the DJIA. One is to use ETFs which allow investors to trade the DJIA as a single security, rather than having to buy shares in all 30 constituent companies. A leading example is the SPDR Dow Jones Industrial Average ETF (DIA). DJIA futures contracts enable traders to speculate on the future value of the index and Options provide the right, but not the obligation, to buy or sell the index at a predetermined price in the future. Mutual funds enable investors to buy a share of a diversified portfolio of DJIA stocks thus providing exposure to the overall index.
Author

Joshua Gibson
FXStreet
Joshua joins the FXStreet team as an Economics and Finance double major from Vancouver Island University with twelve years' experience as an independent trader focusing on technical analysis.


