Dow Jones Industrial Average's week-long stall continues on Friday
- The Dow Jones held steady near record highs to wrap up an uneventful week.
- After weeks of waiting for Fed momentum, investors were left holding the bag by a cautious Powell.
- Hopes for a new trade truce between the US and China have surfaced, limiting losses for the week.

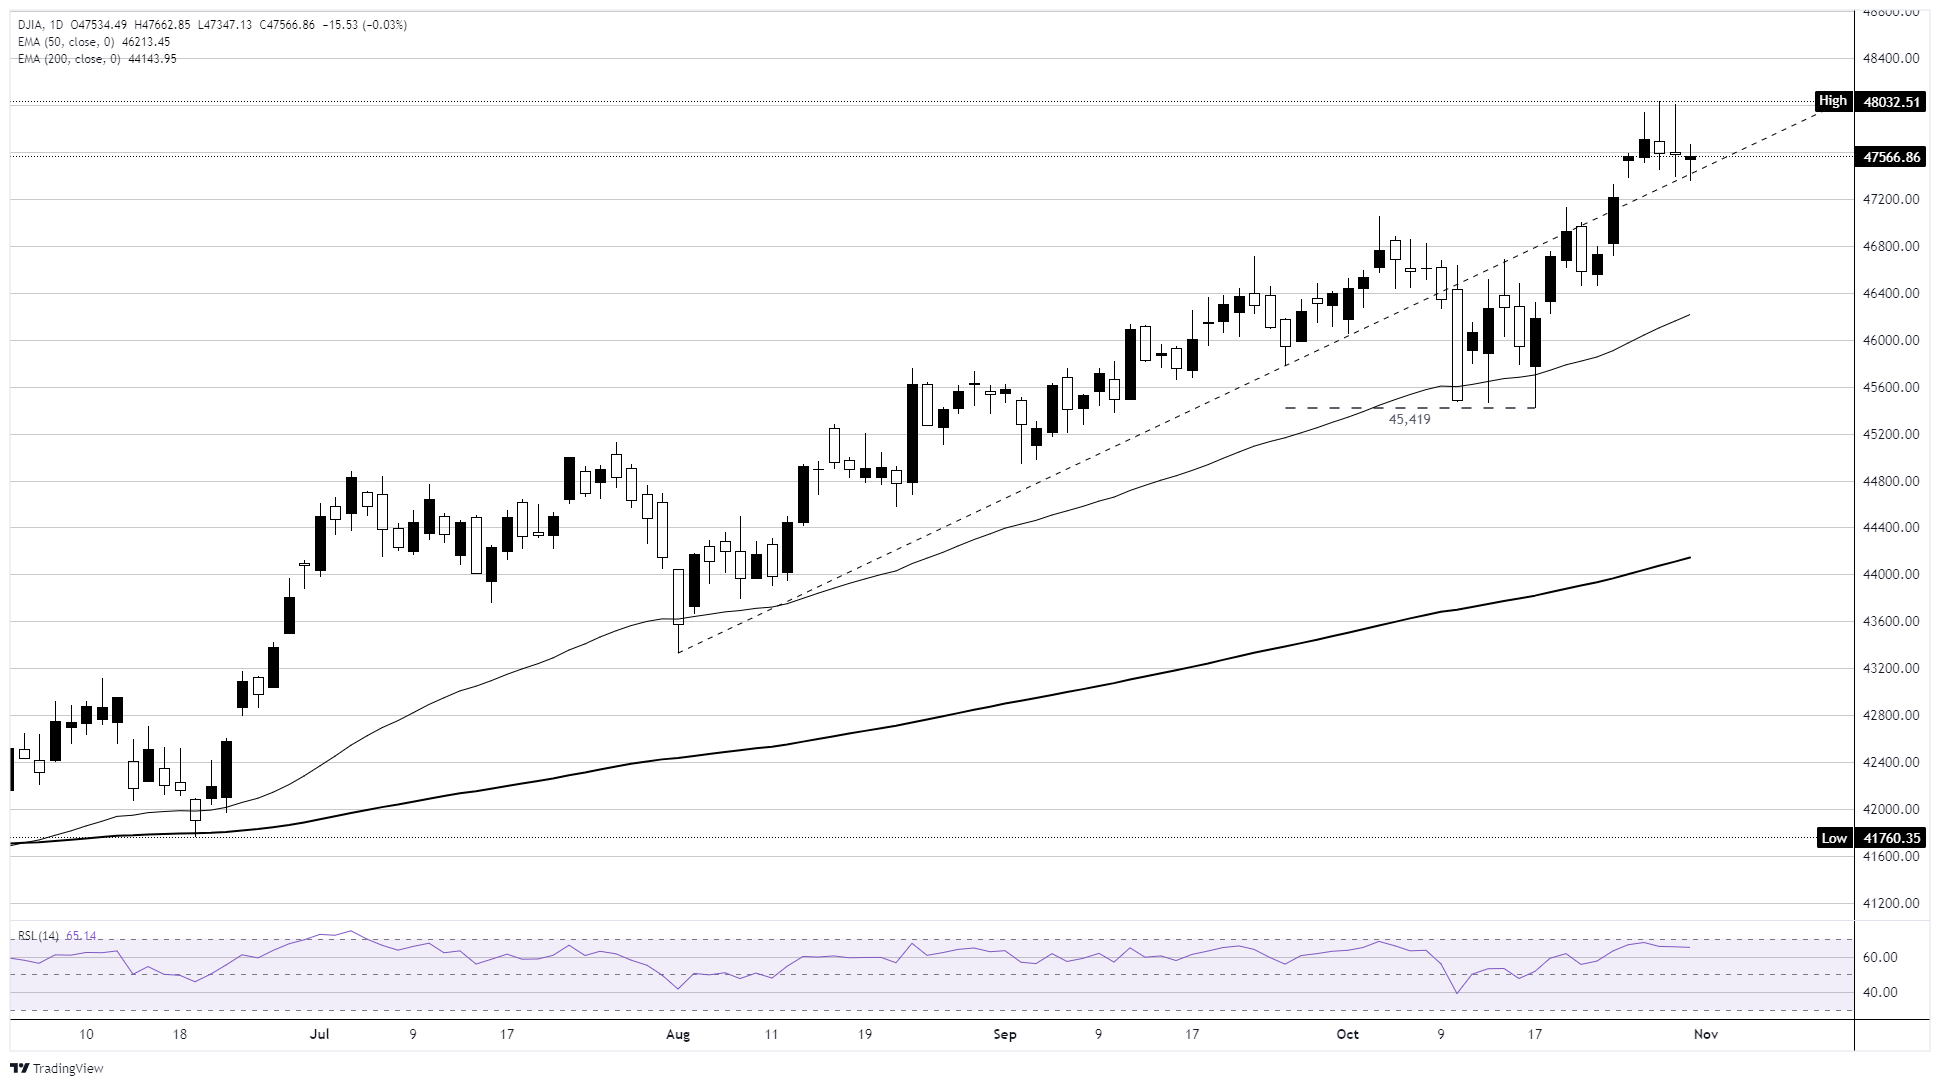
The Dow Jones Industrial Average (DJIA) is poised to end the trading week near where it started, with price action churning familiar territory around the 47,500 region. Despite the Federal Reserve (Fed) delivering a widely anticipated interest rate cut this week and the Dow posting a new all-time high just north of 48,000, equity markets remain overall unimpressed. Bullish momentum has been thin throughout the week, with disappointment at the Fed’s cautious rate-cutting tone offset by hopes that the latest reignition in trade tensions between the US and China will be tamped down by the Trump administration’s general unwillingness to follow through on its own threats.
AI spend continues to be both the golden goose and Achilles' heel of the ongoing tech rally. Key tech giants posted strong earnings on the back of eternally growing demand for hardware architecture to meet the bottomless demand for hardware and storage solutions for learning models. However, a notable lack of profit generation at the actual point of contact between AI solution providers and the general market remains worryingly unmovable.
AI costs continue to rise, good news for the sellers of shovels
Amazon (AMZN) saw a strong Friday rally that single-handedly lifted key indexes into the green for the day, rising after noting a 20% increase in its cloud computing unit’s revenue during the third quarter. On the other side of the same coin, Facebook parent Meta Platforms (META) saw some declines through Friday’s American market session after softly revealing that its expenses in the LLM space have ballooned to tens of billions of dollars, with functionally no revenue to show for its continued investment in playing catchup to other, more established competitors who remain as equally unprofitable net of spiraling investment costs.
The recent flare-up of trade tensions between the US and China appears to have abated for the time being. While nothing is official and no paperwork currently exists, a common trade strategy for the Trump administration, talks between US President Donald Trump and Chinese President Xi Jinping appear to have been at least hypothetically successful, with both sides agreeing to cool down recent protectionist threats for a one-year grace period. China has yet to actually remove any of the trade restrictions it recently imposed or make purchases of US agricultural products at the scale it promised to. In exchange, Donald Trump has promised not to impose new tariffs and trade restrictions that have not yet taken effect. How the trade truce will unfold remains to be seen.
Dow Jones daily chart
Dow Jones FAQs
The Dow Jones Industrial Average, one of the oldest stock market indices in the world, is compiled of the 30 most traded stocks in the US. The index is price-weighted rather than weighted by capitalization. It is calculated by summing the prices of the constituent stocks and dividing them by a factor, currently 0.152. The index was founded by Charles Dow, who also founded the Wall Street Journal. In later years it has been criticized for not being broadly representative enough because it only tracks 30 conglomerates, unlike broader indices such as the S&P 500.
Many different factors drive the Dow Jones Industrial Average (DJIA). The aggregate performance of the component companies revealed in quarterly company earnings reports is the main one. US and global macroeconomic data also contributes as it impacts on investor sentiment. The level of interest rates, set by the Federal Reserve (Fed), also influences the DJIA as it affects the cost of credit, on which many corporations are heavily reliant. Therefore, inflation can be a major driver as well as other metrics which impact the Fed decisions.
Dow Theory is a method for identifying the primary trend of the stock market developed by Charles Dow. A key step is to compare the direction of the Dow Jones Industrial Average (DJIA) and the Dow Jones Transportation Average (DJTA) and only follow trends where both are moving in the same direction. Volume is a confirmatory criteria. The theory uses elements of peak and trough analysis. Dow’s theory posits three trend phases: accumulation, when smart money starts buying or selling; public participation, when the wider public joins in; and distribution, when the smart money exits.
There are a number of ways to trade the DJIA. One is to use ETFs which allow investors to trade the DJIA as a single security, rather than having to buy shares in all 30 constituent companies. A leading example is the SPDR Dow Jones Industrial Average ETF (DIA). DJIA futures contracts enable traders to speculate on the future value of the index and Options provide the right, but not the obligation, to buy or sell the index at a predetermined price in the future. Mutual funds enable investors to buy a share of a diversified portfolio of DJIA stocks thus providing exposure to the overall index.
Author

Joshua Gibson
FXStreet
Joshua joins the FXStreet team as an Economics and Finance double major from Vancouver Island University with twelve years' experience as an independent trader focusing on technical analysis.