Dow Jones Industrial Average declines as investors brace for Fed rate cut and projections
- The Dow Jones struggled on Tuesday, giving up some ground as investors await the Fed.
- A third straight rate cut is widely expected from markets, but jitters remain.
- The Fed’s economic projections will take center stage on Wednesday.

The Dow Jones Industrial Average (DJIA) withered on Tuesday, shedding another 1750 points in a second straight soft day. Rate-cut-hungry markets hunker down for the wait to this week’s hotly anticipated Federal Reserve (Fed) interest rate cut and update to the Fed’s Summary of Economic Projections (SEP).
Fed rate call remains in the crosshairs
Investors remain focused almost entirely on the Fed's December 10 interest rate decision, widely expected to deliver a third consecutive quarter-point cut. The S&P 500 (SP500) rose 0.1% and the Nasdaq gained 0.2%, while the Dow slipped slightly, falling 0.35%. Fed funds futures now imply an ~87% chance of a cut, up sharply from a month ago. Traders say the outcome of the Fed’s latest rate call, and especially Fed Chair Jerome Powell’s policy stance during one of his last rate call press conferences, could set the tone for the remainder of December as markets weigh sticky inflation, delayed economic data, and the long runway toward new Fed leadership in 2026.
Behind the immediate rate decision, analysts say markets are already starting to look toward the next phase of Fed leadership and potential changes in communication strategy after a year of volatile expectations. With the Fed’s dual mandate still challenged by uneven inflation and cooling labor dynamics, investors are watching closely to see whether policymakers can maintain an accommodative stance in 2026 or if economic conditions force a more cautious approach.
Rate-sensitive stocks gain ground on rate cut hopes
Momentum was strongest in rate-sensitive pockets of the market. The Russell 2000 hit a fresh intraday record as lower borrowing costs are seen benefiting small caps. Silver miners also surged after Silver futures touched a record high above $61 per ounce. Meanwhile, earnings and sector-specific news added pockets of strength: CVS climbed on a stronger profit outlook, and Colgate-Palmolive (CL) gained after an analyst upgrade.
Broader macro data painted a mixed picture: JOLTS job openings held steady through both September and October, but the pace of both hiring and quits slowed heading into the fourth quarter. Small business inflation concerns also spiked to their highest level since early 2023 as tariffs continue to eat away at the underside of the US economy.
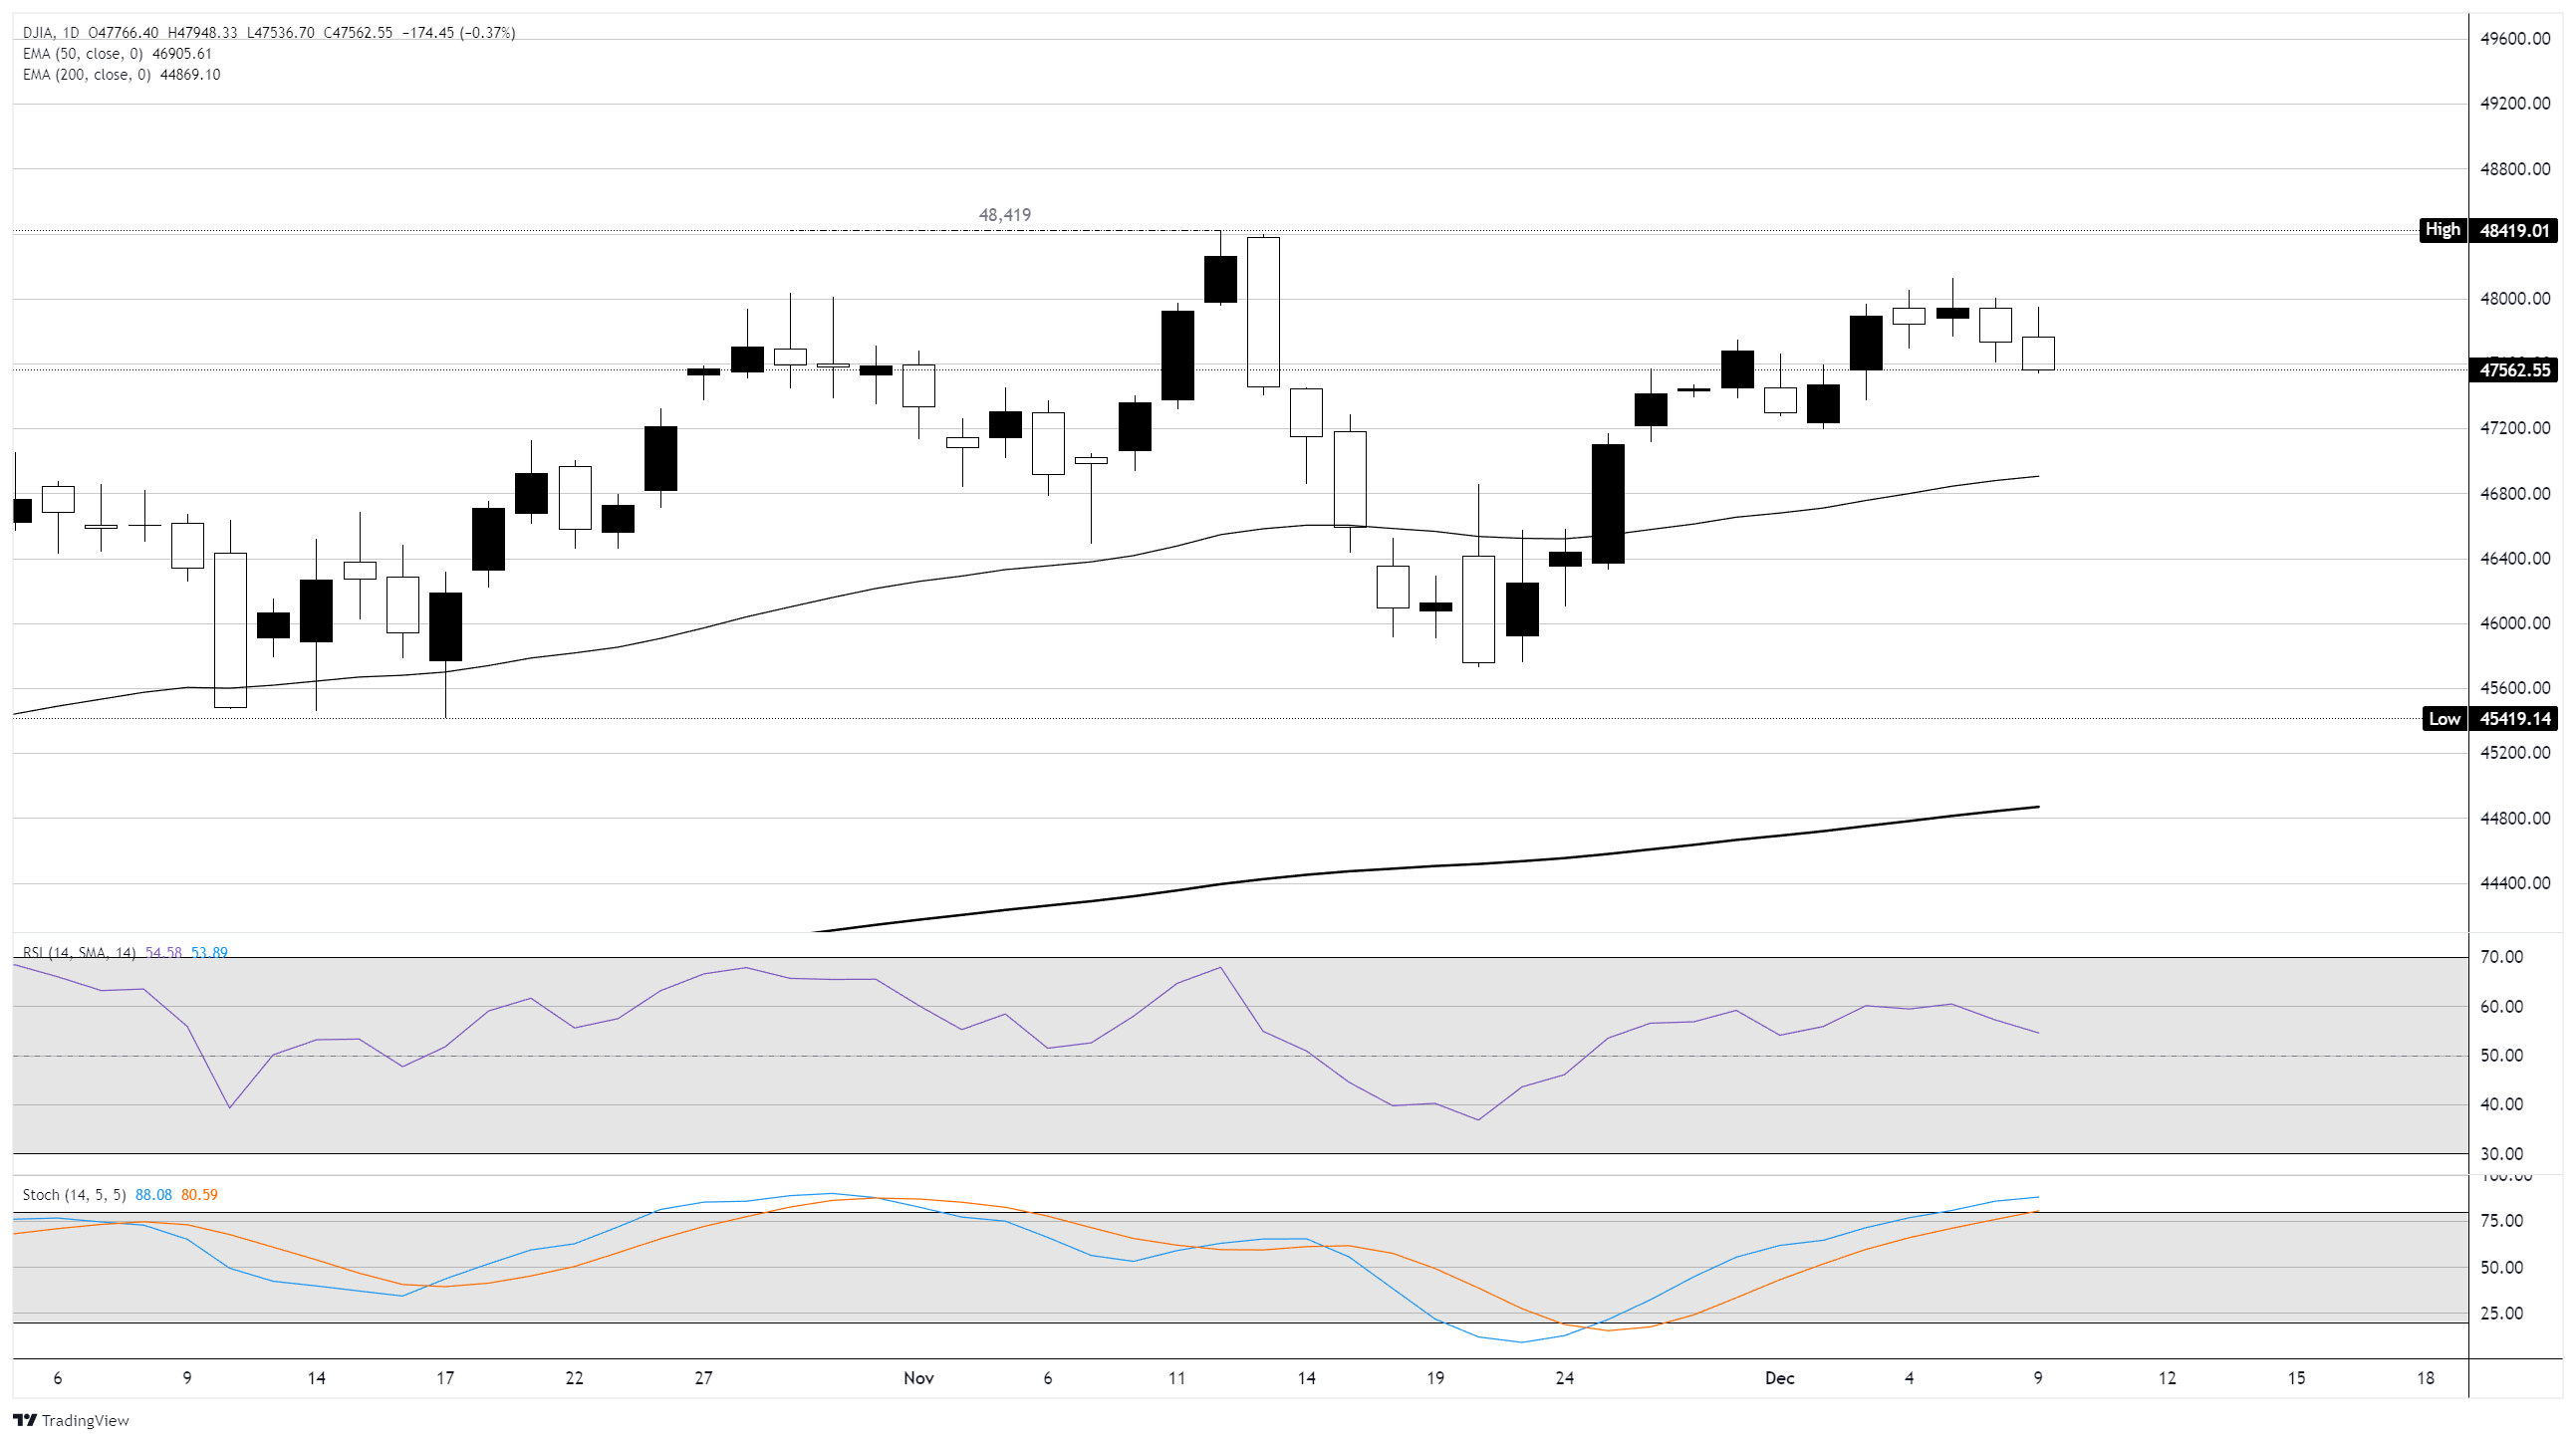
Dow Jones daily chart
Dow Jones FAQs
The Dow Jones Industrial Average, one of the oldest stock market indices in the world, is compiled of the 30 most traded stocks in the US. The index is price-weighted rather than weighted by capitalization. It is calculated by summing the prices of the constituent stocks and dividing them by a factor, currently 0.152. The index was founded by Charles Dow, who also founded the Wall Street Journal. In later years it has been criticized for not being broadly representative enough because it only tracks 30 conglomerates, unlike broader indices such as the S&P 500.
Many different factors drive the Dow Jones Industrial Average (DJIA). The aggregate performance of the component companies revealed in quarterly company earnings reports is the main one. US and global macroeconomic data also contributes as it impacts on investor sentiment. The level of interest rates, set by the Federal Reserve (Fed), also influences the DJIA as it affects the cost of credit, on which many corporations are heavily reliant. Therefore, inflation can be a major driver as well as other metrics which impact the Fed decisions.
Dow Theory is a method for identifying the primary trend of the stock market developed by Charles Dow. A key step is to compare the direction of the Dow Jones Industrial Average (DJIA) and the Dow Jones Transportation Average (DJTA) and only follow trends where both are moving in the same direction. Volume is a confirmatory criteria. The theory uses elements of peak and trough analysis. Dow’s theory posits three trend phases: accumulation, when smart money starts buying or selling; public participation, when the wider public joins in; and distribution, when the smart money exits.
There are a number of ways to trade the DJIA. One is to use ETFs which allow investors to trade the DJIA as a single security, rather than having to buy shares in all 30 constituent companies. A leading example is the SPDR Dow Jones Industrial Average ETF (DIA). DJIA futures contracts enable traders to speculate on the future value of the index and Options provide the right, but not the obligation, to buy or sell the index at a predetermined price in the future. Mutual funds enable investors to buy a share of a diversified portfolio of DJIA stocks thus providing exposure to the overall index.
Author

Joshua Gibson
FXStreet
Joshua joins the FXStreet team as an Economics and Finance double major from Vancouver Island University with twelve years' experience as an independent trader focusing on technical analysis.


