Dow Jones Industrial Average grapples with ongoing tariff and trade fears
- The Dow Jones continues to churn near 42,000 as investors await calmer trade headlines.
- The Trump administration is set to impose stiff steel tariff increases.
- Donald Trump’s legal battle around global tariffs has deepened this week.

The Dow Jones Industrial Average (DJIA) remains trapped in near-term congestion as trade woes weigh on investors and the new trading month kicks off on a cautious note. United States (US) President Donald Trump promised a doubling of steel tariffs to 50% while attending a steelworkers’ union rally late last week. US-China trade tensions are also escalating as both sides lob accusations of early trade agreement violations.
Plaintiffs filed a motion on Monday in the US Court of International Trade (USCIT) to halt Donald Trump’s pre-existing tariffs, which were ruled as an overreach of presidential powers after the USCIT determined that the White House had misinterpreted the International Emergency Economic Powers Act. The federal appeals circuit granted a stay of the tariffs while the appellate process grinds away, which could take months. According to fresh filings from the USCIT, allowing the tariffs to remain in place during the appeals process effectively rules in favor of the Trump administration without issuing a formal ruling.
Trade concerns, tariff fears rule the roost to kick off June trading
Donald Trump triumphantly announced a doubling of tariffs on all steel imports into the US last Friday. Speaking before the national assembly of the United Auto Workers union, President Trump announced that he intends to double steel import taxes to 50%, a move that would likely result in US consumers paying even more for steel products. US domestic prices for steel products are already some of the highest in the world, and prices could rise even further.
Speaking to reporters at CNBC, Josh Spoores, Head of Steel Americas Analysis at CRU, noted that raising steel tariffs would make selling steel to the US even more attractive to foreign companies, as the US functionally forces itself to pay higher prices:
“Already steel prices in the U.S. are higher than anywhere else, and it is a net importer which needs to have volumes coming in. All this does is raise prices there… automotives, construction products and appliances are all products that are going to feel the impact.”
President Trump lobbed social media attack posts at China last week, expressing apparent frustration at China’s slow pace of easing rare earths export restrictions. China responded by categorically rejecting Trump’s claims, noting that it is moving at an already agreed-upon pace on trade terms loosely negotiated in Switzerland several weeks ago. China also fired back its own claims of trade deal violations by the Trump administration. According to a Chinese spokesperson, the White House’s recently announced plans to further curb tech exports to China and revoke student visas for Chinese students “unilaterally provoke new economic and trade frictions.”
Further caution warranted according to PMI survey results
Business confidence may be getting hit harder by constantly changing tariff policies than market experts initially expected. May’s ISM Manufacturing Purchasing Managers Index (PMI) backslid to a fresh six-month low on Monday, falling to 48.5 when median market forecasts were expecting a modest uptick to 49.5. US manufacturing activity is expected to contract in May, with demand, output, and inputs all expected to weaken.
Read more stock news: Cleveland-Cliffs stock surges 27% as Trump aims to double steel tariffs
Dow Jones price forecast
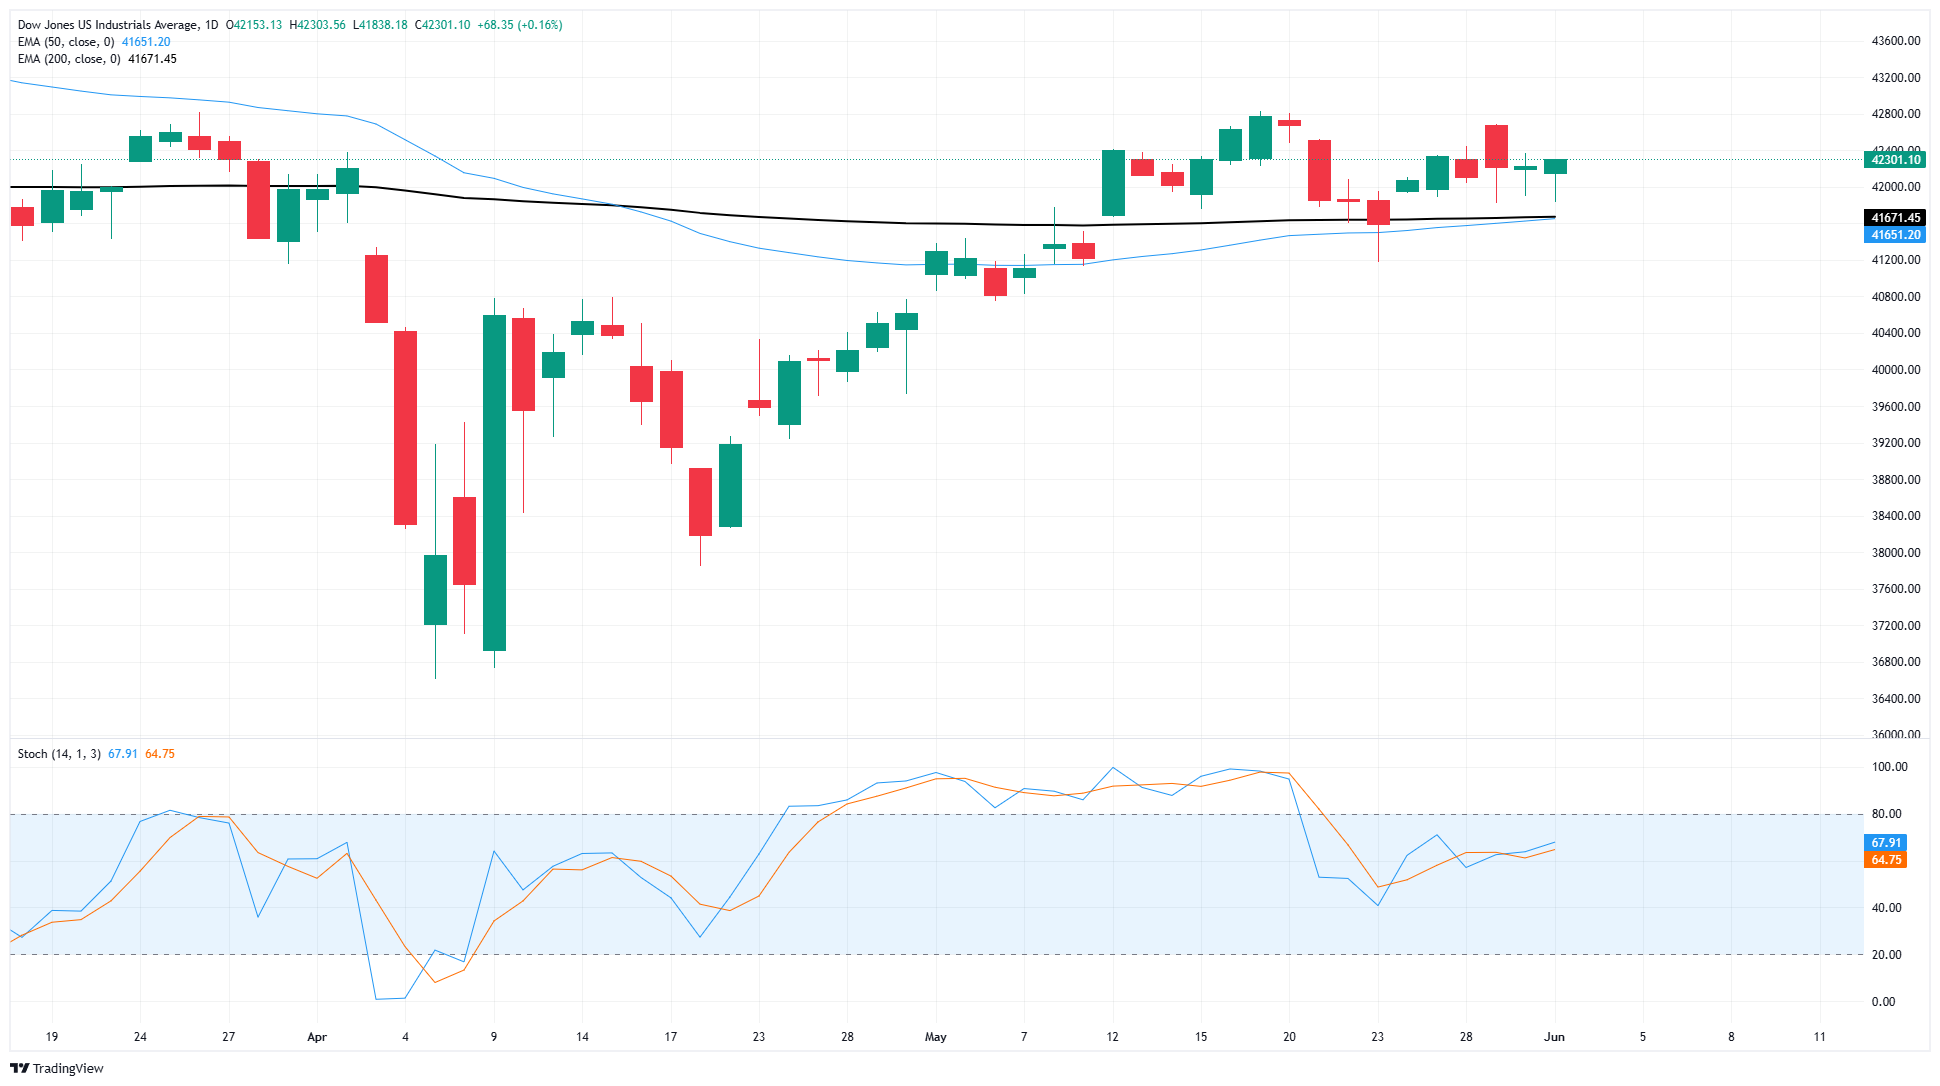
Ongoing trade headlines, tariff headaches, and apprehension about economic activity within the US economy have all weighed on equities. Major equity indexes plummeted earlier in the year due to Trump's tariffs, sending the Dow Jones to the 37,000 region. The technical recovery from April’s lows successfully pushed bids back onto the bullish side of the 200-day Exponential Moving Average (EMA) near 41,600, but momentum appears to have evaporated for the time being.
The Dow Jones has entered a middling consolidation phase between 41,000 and 43,000. Price action is geared to continue grinding sideways until material changes to the US’s trade stance or economic data push investors firmly into one side or the other.
Dow Jones daily chart
Dow Jones FAQs
The Dow Jones Industrial Average, one of the oldest stock market indices in the world, is compiled of the 30 most traded stocks in the US. The index is price-weighted rather than weighted by capitalization. It is calculated by summing the prices of the constituent stocks and dividing them by a factor, currently 0.152. The index was founded by Charles Dow, who also founded the Wall Street Journal. In later years it has been criticized for not being broadly representative enough because it only tracks 30 conglomerates, unlike broader indices such as the S&P 500.
Many different factors drive the Dow Jones Industrial Average (DJIA). The aggregate performance of the component companies revealed in quarterly company earnings reports is the main one. US and global macroeconomic data also contributes as it impacts on investor sentiment. The level of interest rates, set by the Federal Reserve (Fed), also influences the DJIA as it affects the cost of credit, on which many corporations are heavily reliant. Therefore, inflation can be a major driver as well as other metrics which impact the Fed decisions.
Dow Theory is a method for identifying the primary trend of the stock market developed by Charles Dow. A key step is to compare the direction of the Dow Jones Industrial Average (DJIA) and the Dow Jones Transportation Average (DJTA) and only follow trends where both are moving in the same direction. Volume is a confirmatory criteria. The theory uses elements of peak and trough analysis. Dow’s theory posits three trend phases: accumulation, when smart money starts buying or selling; public participation, when the wider public joins in; and distribution, when the smart money exits.
There are a number of ways to trade the DJIA. One is to use ETFs which allow investors to trade the DJIA as a single security, rather than having to buy shares in all 30 constituent companies. A leading example is the SPDR Dow Jones Industrial Average ETF (DIA). DJIA futures contracts enable traders to speculate on the future value of the index and Options provide the right, but not the obligation, to buy or sell the index at a predetermined price in the future. Mutual funds enable investors to buy a share of a diversified portfolio of DJIA stocks thus providing exposure to the overall index.
Author

Joshua Gibson
FXStreet
Joshua joins the FXStreet team as an Economics and Finance double major from Vancouver Island University with twelve years' experience as an independent trader focusing on technical analysis.


