Dow Jones Industrial Average tries to climb, but slumps to end Friday down after NFP surge
- Dow Jones grinds into the middle as investors fail to shrug off declining rate cut bets.
- The US added 272K net new jobs in May.
- US wages also climbed faster than expected, crumpling September rate cut hopes.

The Dow Jones Industrial Average (DJIA) tried to shrug off a forecast-thumping Nonfarm Payrolls (NFP) print on Friday, climbing into a brief 0.2% gain through the US market session before slumping back into a -0.2% decline, shedding nearly 90 points on Friday.
US Nonfarm Payrolls delivered its third-best monthly net job gains on Friday, adding 272K new employment positions in May, well above the forecast 185K. The figure handily beat the previous month’s figure, which was revised slightly lower to 165K from 175K.
US Average Hourly Earnings also climbed faster than expected, showing wages increased 0.4% MoM versus the forecast 0.3% and the previous 0.2%. Meanwhile, the US Unemployment Rate also ticked up to its highest level since February 2022, printing at 4.0% versus the expected hold at 3.9%.
With the US economy continuing to outperform investor expectations, broad-market hopes for Federal Reserve (Fed) rate cuts continue to get battered. According to the CME’s FedWatch Tool, rate traders are now pricing in less than 50% odds of at least a quarter-point rate trim from the Fed on September 8, down significantly from the 70% odds that were priced in until just before Friday’s NFP print.
Economic Indicator
Nonfarm Payrolls
The Nonfarm Payrolls release presents the number of new jobs created in the US during the previous month in all non-agricultural businesses; it is released by the US Bureau of Labor Statistics (BLS). The monthly changes in payrolls can be extremely volatile. The number is also subject to strong reviews, which can also trigger volatility in the Forex board. Generally speaking, a high reading is seen as bullish for the US Dollar (USD), while a low reading is seen as bearish, although previous months' reviews and the Unemployment Rate are as relevant as the headline figure. The market's reaction, therefore, depends on how the market assesses all the data contained in the BLS report as a whole.
Read more.Last release: Fri Jun 07, 2024 12:30
Frequency: Monthly
Actual: 272K
Consensus: 185K
Previous: 175K
Source: US Bureau of Labor Statistics
America’s monthly jobs report is considered the most important economic indicator for forex traders. Released on the first Friday following the reported month, the change in the number of positions is closely correlated with the overall performance of the economy and is monitored by policymakers. Full employment is one of the Federal Reserve’s mandates and it considers developments in the labor market when setting its policies, thus impacting currencies. Despite several leading indicators shaping estimates, Nonfarm Payrolls tend to surprise markets and trigger substantial volatility. Actual figures beating the consensus tend to be USD bullish.
Dow Jones news
Post-NFP jitters plagued the DJIA on Friday. barely half of the major index’s constituent securities are in the green on the day, with gains being led by 3M Co. (MMM), which gained nearly 2.7% in Friday’s trading. 3M’s stock was recently upgraded to a “buy” by Bank of America analysts, prompting investors to do just that. 3M crossed over $100 per share on Friday, settling at $100.86 on the day and is up nearly 12% for the year.
On the low side, Unitedhealth Group Inc. (UNH) tumbled -2.24% on Friday, falling to $490.69 per share. UNH is down around -6.25% from mid-May’s peak near $525.00 per share, and Friday’s share prices are shedding further weight following the announcement of a shareholder lawsuit against the company for alleged losses stemming from securities fraud committed by the healthcare company between March 2022 and February 2024.
Dow Jones technical outlook
The Dow Jones tested the 39,000.00 handle in an intraday recovery on Friday, but fell back below the day’s opening range near 38,880.00. The index is holding steady after recent recovery bids from a near-term low at the 38,000.00 level, but Friday shaped up to be another soft day to round out the trading week.
The Dow Jones continues to waffle after falling from record all-time highs above 40,000.00, and still remains down -3% from record peaks in May. A firm demand zone is priced in between 38,000.00 and 37,500.00, and the major equity index is still trading deep into bull country above the 200-day Exponential Moving Average (EMA) at 37,299.82.
Dow Jones five minute chart
Dow Jones daily chart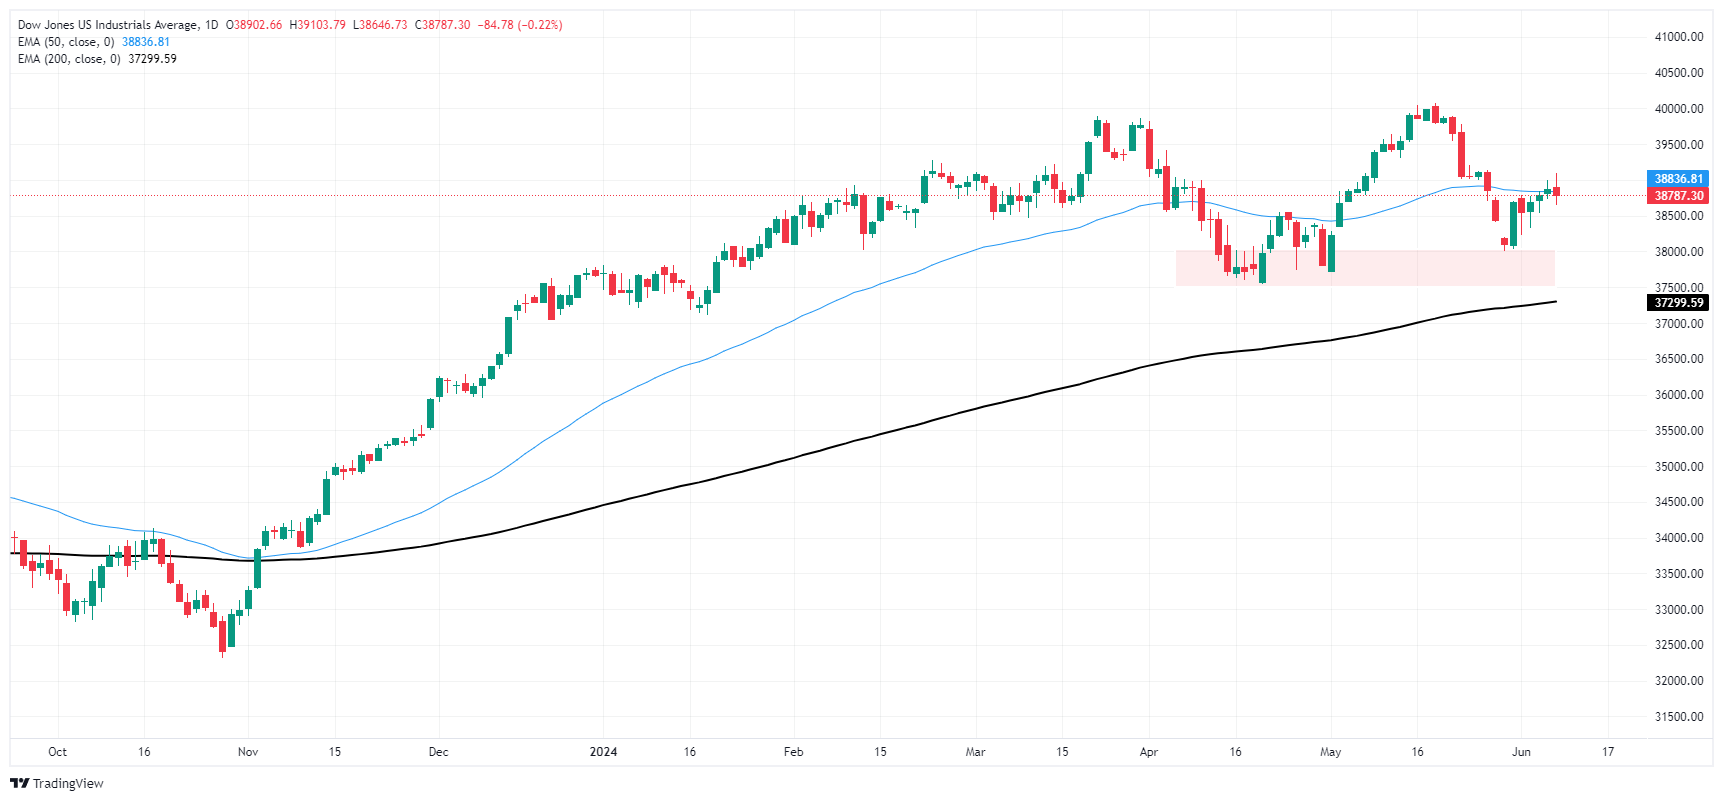
Dow Jones FAQs
The Dow Jones Industrial Average, one of the oldest stock market indices in the world, is compiled of the 30 most traded stocks in the US. The index is price-weighted rather than weighted by capitalization. It is calculated by summing the prices of the constituent stocks and dividing them by a factor, currently 0.152. The index was founded by Charles Dow, who also founded the Wall Street Journal. In later years it has been criticized for not being broadly representative enough because it only tracks 30 conglomerates, unlike broader indices such as the S&P 500.
Many different factors drive the Dow Jones Industrial Average (DJIA). The aggregate performance of the component companies revealed in quarterly company earnings reports is the main one. US and global macroeconomic data also contributes as it impacts on investor sentiment. The level of interest rates, set by the Federal Reserve (Fed), also influences the DJIA as it affects the cost of credit, on which many corporations are heavily reliant. Therefore, inflation can be a major driver as well as other metrics which impact the Fed decisions.
Dow Theory is a method for identifying the primary trend of the stock market developed by Charles Dow. A key step is to compare the direction of the Dow Jones Industrial Average (DJIA) and the Dow Jones Transportation Average (DJTA) and only follow trends where both are moving in the same direction. Volume is a confirmatory criteria. The theory uses elements of peak and trough analysis. Dow’s theory posits three trend phases: accumulation, when smart money starts buying or selling; public participation, when the wider public joins in; and distribution, when the smart money exits.
There are a number of ways to trade the DJIA. One is to use ETFs which allow investors to trade the DJIA as a single security, rather than having to buy shares in all 30 constituent companies. A leading example is the SPDR Dow Jones Industrial Average ETF (DIA). DJIA futures contracts enable traders to speculate on the future value of the index and Options provide the right, but not the obligation, to buy or sell the index at a predetermined price in the future. Mutual funds enable investors to buy a share of a diversified portfolio of DJIA stocks thus providing exposure to the overall index.
Author

Joshua Gibson
FXStreet
Joshua joins the FXStreet team as an Economics and Finance double major from Vancouver Island University with twelve years' experience as an independent trader focusing on technical analysis.


