Dow Jones Industrial Average soars 1,500 points after early US presidential election results
- The Dow Jones reached a new record high after Trump looks set to beat Harris into the White House.
- A decisive election result is tipping stocks into a frenzy on hopes for deregulation.
- The Dow Jones is up 3.6% for the week with banking stocks charging to the top.

The Dow Jones Industrial Average (DJIA) surged to a fresh record on Wednesday, climbing into 43,700 after US presidential candidate looks set to sweep a victory away from Democratic nominee and current Vice President Kamala Harris. Equities are surging on expectations of stock-friendly moves from future President Donald Trump, specifically hopes for further deregulation in the banking sector.
The US presidential election still isn’t over, and some key battlegrounds will take some time before a final call is made, but markets are confident that the outcome has been decided, with Republican candidate and former President Donald Trump set to win 276 electoral votes. With the Republicans also set to win back both the US Senate and Congress, investors are anticipating a pro-growth environment with more deregulation as well as additional or extended business tax cuts.
Dow Jones news
About two-thirds of the Dow Jones board is tilted into the green on Wednesday. Companies burdened with physical inventories and logistics like Home Depot (HD) and Nike (NKE) were left out of the post-election spluge, with Home Depot falling nearly 4% to $385 per share and Nike backsliding 3.5% to $75 per share.
On the top end, Goldman Sachs (GS) and JPMorgan Chase (JPM) both hit the upper atmosphere, climbing over 12% and 10%, respectively. Goldman Sachs is knocking on $595 per share, with JPMorgan Chase stretching past $245 per share.
Dow Jones price forecast
A firm bullish tilt to the Dow Jones daily candlesticks leaves short sellers with lots of potential but few opportunities. The DJIA has stretched firmly into fresh record territory north of 43,600, but a lack of meaningful technical signs for a turnaround leaves timing a short entry a hazardous process.
A downside snap as equity traders cool their jets after the election results could easily send price action back to the 50-day Exponential Moving Average (EMA) near 41,970. However, short pressure will first need to drag bids back to planet earth near 43,200.
Dow Jones daily chart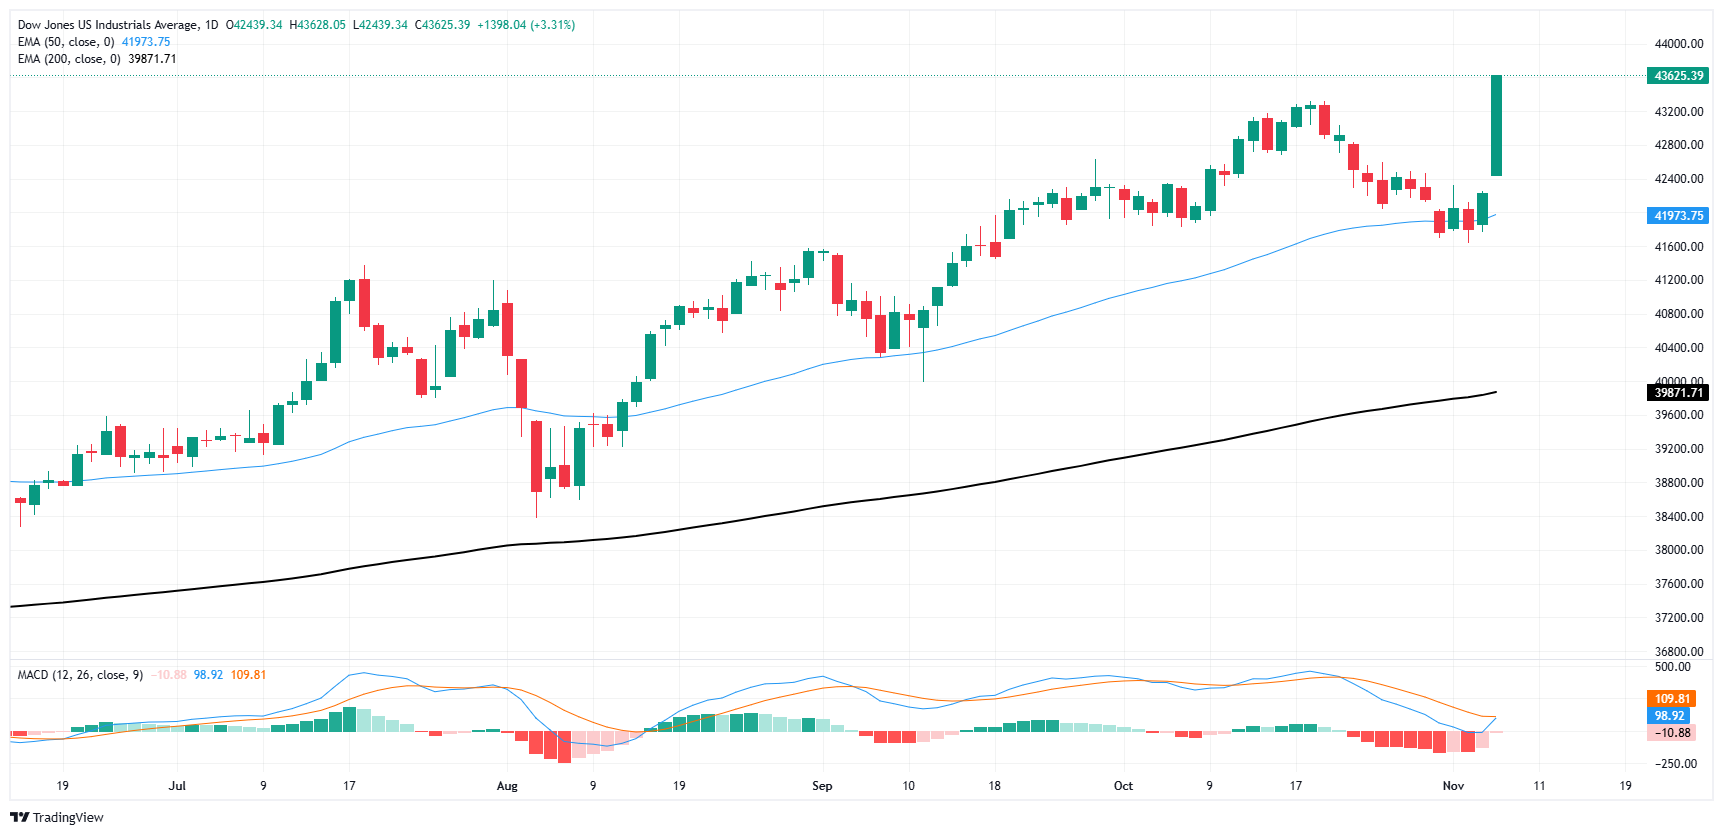
Dow Jones FAQs
The Dow Jones Industrial Average, one of the oldest stock market indices in the world, is compiled of the 30 most traded stocks in the US. The index is price-weighted rather than weighted by capitalization. It is calculated by summing the prices of the constituent stocks and dividing them by a factor, currently 0.152. The index was founded by Charles Dow, who also founded the Wall Street Journal. In later years it has been criticized for not being broadly representative enough because it only tracks 30 conglomerates, unlike broader indices such as the S&P 500.
Many different factors drive the Dow Jones Industrial Average (DJIA). The aggregate performance of the component companies revealed in quarterly company earnings reports is the main one. US and global macroeconomic data also contributes as it impacts on investor sentiment. The level of interest rates, set by the Federal Reserve (Fed), also influences the DJIA as it affects the cost of credit, on which many corporations are heavily reliant. Therefore, inflation can be a major driver as well as other metrics which impact the Fed decisions.
Dow Theory is a method for identifying the primary trend of the stock market developed by Charles Dow. A key step is to compare the direction of the Dow Jones Industrial Average (DJIA) and the Dow Jones Transportation Average (DJTA) and only follow trends where both are moving in the same direction. Volume is a confirmatory criteria. The theory uses elements of peak and trough analysis. Dow’s theory posits three trend phases: accumulation, when smart money starts buying or selling; public participation, when the wider public joins in; and distribution, when the smart money exits.
There are a number of ways to trade the DJIA. One is to use ETFs which allow investors to trade the DJIA as a single security, rather than having to buy shares in all 30 constituent companies. A leading example is the SPDR Dow Jones Industrial Average ETF (DIA). DJIA futures contracts enable traders to speculate on the future value of the index and Options provide the right, but not the obligation, to buy or sell the index at a predetermined price in the future. Mutual funds enable investors to buy a share of a diversified portfolio of DJIA stocks thus providing exposure to the overall index.
Author

Joshua Gibson
FXStreet
Joshua joins the FXStreet team as an Economics and Finance double major from Vancouver Island University with twelve years' experience as an independent trader focusing on technical analysis.


