Dow Jones Industrial Average eases slightly as equities await bigger news
- The Dow Jones shed a scant 100 points on Wednesday, easing back toward 42,000.
- A midweek lull in data releases and major headlines is giving equity markets a breather.
- US PPI inflation, Retail Sales, and UoM consumer survey results still lurk ahead this week.

The Dow Jones Industrial Average (DJIA) eased slightly lower on Wednesday, slipping back toward the 42,000 handle as equity markets spin in place during a calm midweek market session. Most of the major equity indexes have clawed back YTD losses, thanks in no small part to a determined bullish tilt in tech stocks.
There is a notable gap between key data releases this week, and traders are getting some room to breathe before the next batch of figures drops. United States (US) Producer Price Index (PPI) inflation data is slated for Thursday, alongside US Retail Sales. Annualized PPI is expected to ease slightly to 3.1% from 3.3%, while April’s MoM figure is expected to tick up to 0.3% from -0.1%. Retail Sales in April are also expected to ease to a flat 0.0% from March’s revised 1.5%.
Tariffs impacts still to come
Market experts warned that this April’s dual inflation prints this week could be the last bright spot on the years-long inflation fight. According to analysts, economic impacts from the Trump administration’s ham-handed trade strategies are expected to begin showing up in the data in May. Even as the Trump team explores pulling back on its own tariff policies, the Effective Tariff Rate (ETR) on most countries will hold above 13%, a number that has typically averaged somewhere near 2.5% in the past. Even with the White House’s cancellation of triple-digit tariffs on China, the US’s ETR on Chinese goods is expected to remain over 30% for the next quarter. Despite President Donald Trump’s insistence that “other countries” will be paying the tariffs, import taxes are generally charged at the entry point into the domestic economy and extracted from domestic businesses, who tend to pass those costs onto consumers directly.
In the face of rising costs being levied directly against the US by its own administration, Friday’s University of Michigan (UoM) Consumer Sentiment Index is unlikely to show much improvement. US consumers are growing increasingly apprehensive about their economic outlook and income expectations. However, median market forecasts are hoping for a slight uptick in the UoM’s key sentiment reading, with the index expected to tick up to 53.4 from its two-year low of 52.2.
Read more stock news: UnitedHealth Group stock recovers Wednesday downgrades
Dow Jones price forecast
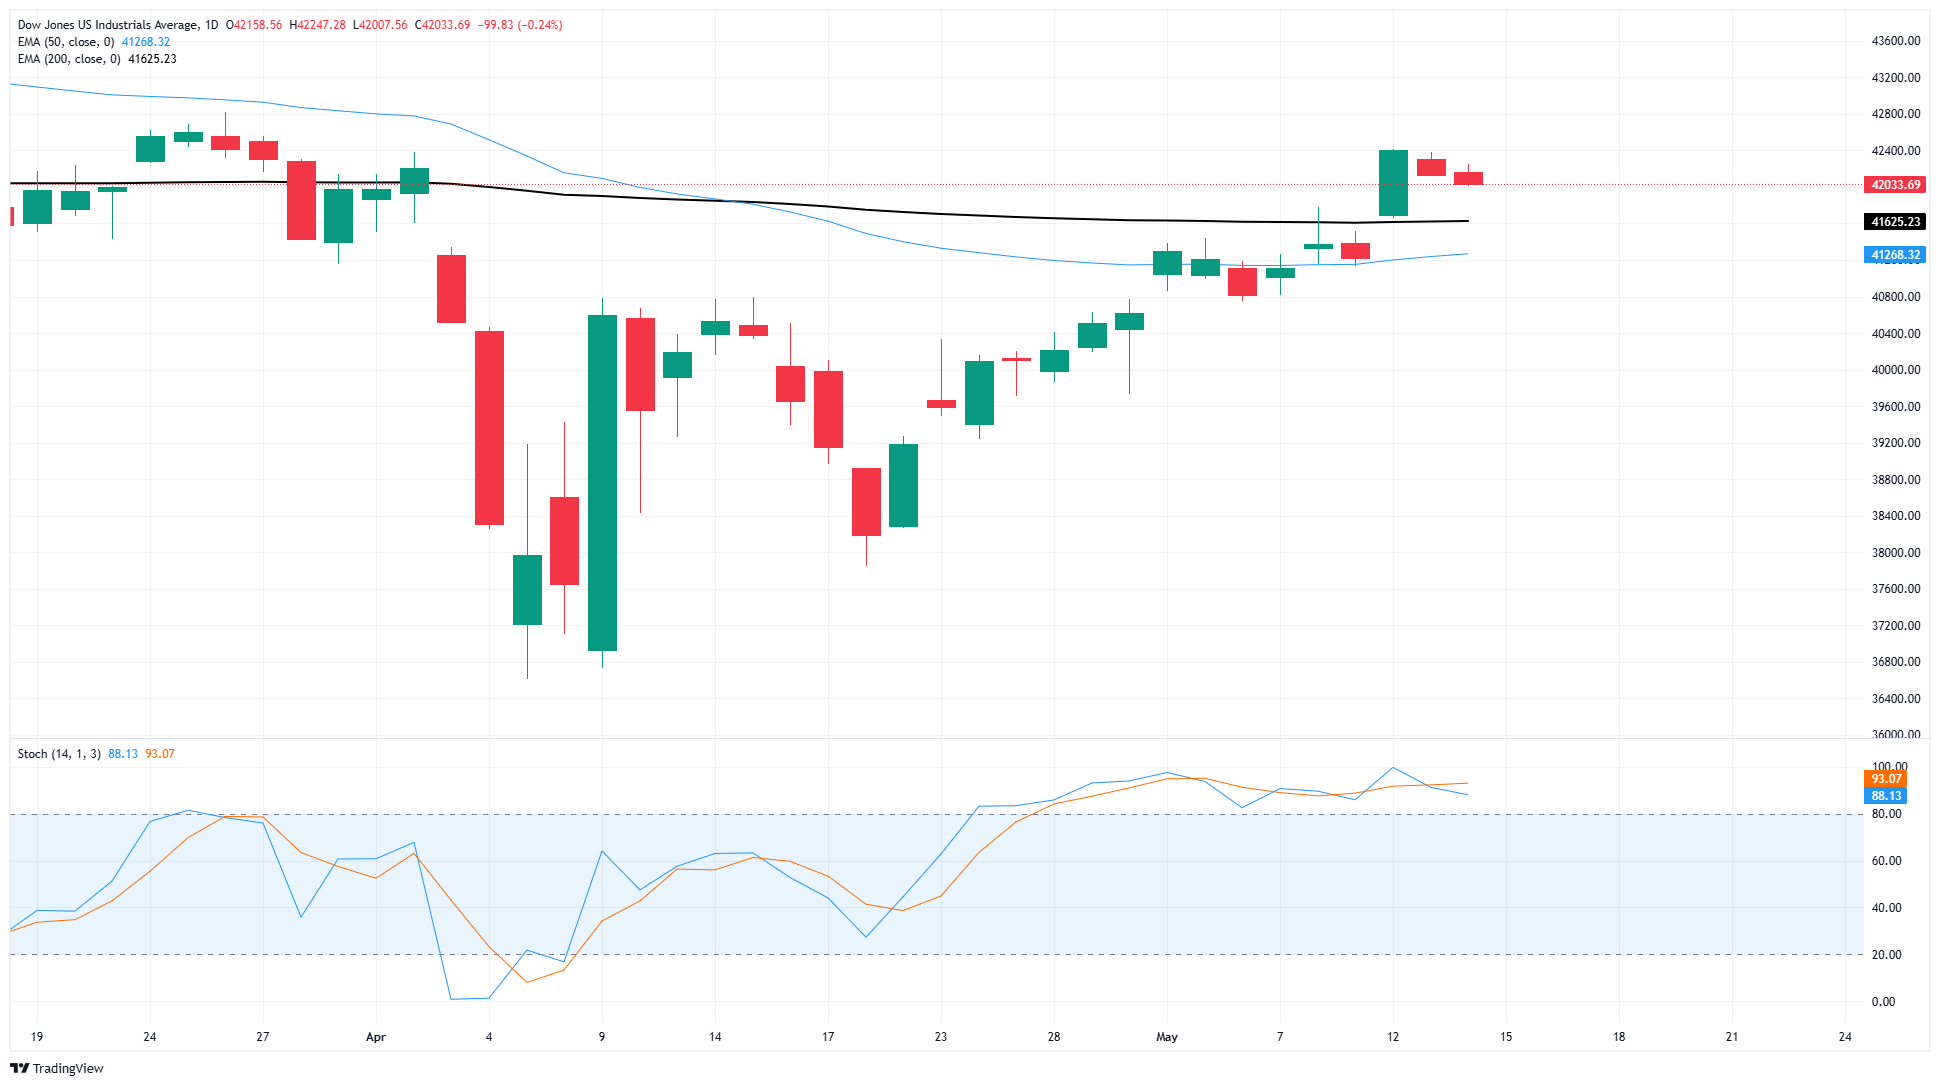
The Dow Jones has stopped its early-week ascent, slowing down and resting near 42,000. The major equity index is still up around 1.15% this week and has recovered approximately 14% since the significant drop to the 36,600 area in early April. This week’s topside breach of the 200-day Exponential Moving Average (EMA) around 41,500 has shifted the Dow Jones back into bullish territory, prompting buyers to aim for continued momentum to push prices back towards record highs exceeding 45,000.
Dow Jones daily chart
Dow Jones FAQs
The Dow Jones Industrial Average, one of the oldest stock market indices in the world, is compiled of the 30 most traded stocks in the US. The index is price-weighted rather than weighted by capitalization. It is calculated by summing the prices of the constituent stocks and dividing them by a factor, currently 0.152. The index was founded by Charles Dow, who also founded the Wall Street Journal. In later years it has been criticized for not being broadly representative enough because it only tracks 30 conglomerates, unlike broader indices such as the S&P 500.
Many different factors drive the Dow Jones Industrial Average (DJIA). The aggregate performance of the component companies revealed in quarterly company earnings reports is the main one. US and global macroeconomic data also contributes as it impacts on investor sentiment. The level of interest rates, set by the Federal Reserve (Fed), also influences the DJIA as it affects the cost of credit, on which many corporations are heavily reliant. Therefore, inflation can be a major driver as well as other metrics which impact the Fed decisions.
Dow Theory is a method for identifying the primary trend of the stock market developed by Charles Dow. A key step is to compare the direction of the Dow Jones Industrial Average (DJIA) and the Dow Jones Transportation Average (DJTA) and only follow trends where both are moving in the same direction. Volume is a confirmatory criteria. The theory uses elements of peak and trough analysis. Dow’s theory posits three trend phases: accumulation, when smart money starts buying or selling; public participation, when the wider public joins in; and distribution, when the smart money exits.
There are a number of ways to trade the DJIA. One is to use ETFs which allow investors to trade the DJIA as a single security, rather than having to buy shares in all 30 constituent companies. A leading example is the SPDR Dow Jones Industrial Average ETF (DIA). DJIA futures contracts enable traders to speculate on the future value of the index and Options provide the right, but not the obligation, to buy or sell the index at a predetermined price in the future. Mutual funds enable investors to buy a share of a diversified portfolio of DJIA stocks thus providing exposure to the overall index.
Author

Joshua Gibson
FXStreet
Joshua joins the FXStreet team as an Economics and Finance double major from Vancouver Island University with twelve years' experience as an independent trader focusing on technical analysis.


