Dow Jones Industrial Average rises to retest 46,000 ahead of Fed rate call
- The Dow Jones saw hopeful gains ahead of the Fed’s latest interest rate decision.
- The Fed is broadly expected to deliver a quarter-point cut, but edge case for 50 bps remains.
- Rate traders are primarily concerned about whether or not the Fed will pivot into three straight rate cuts.

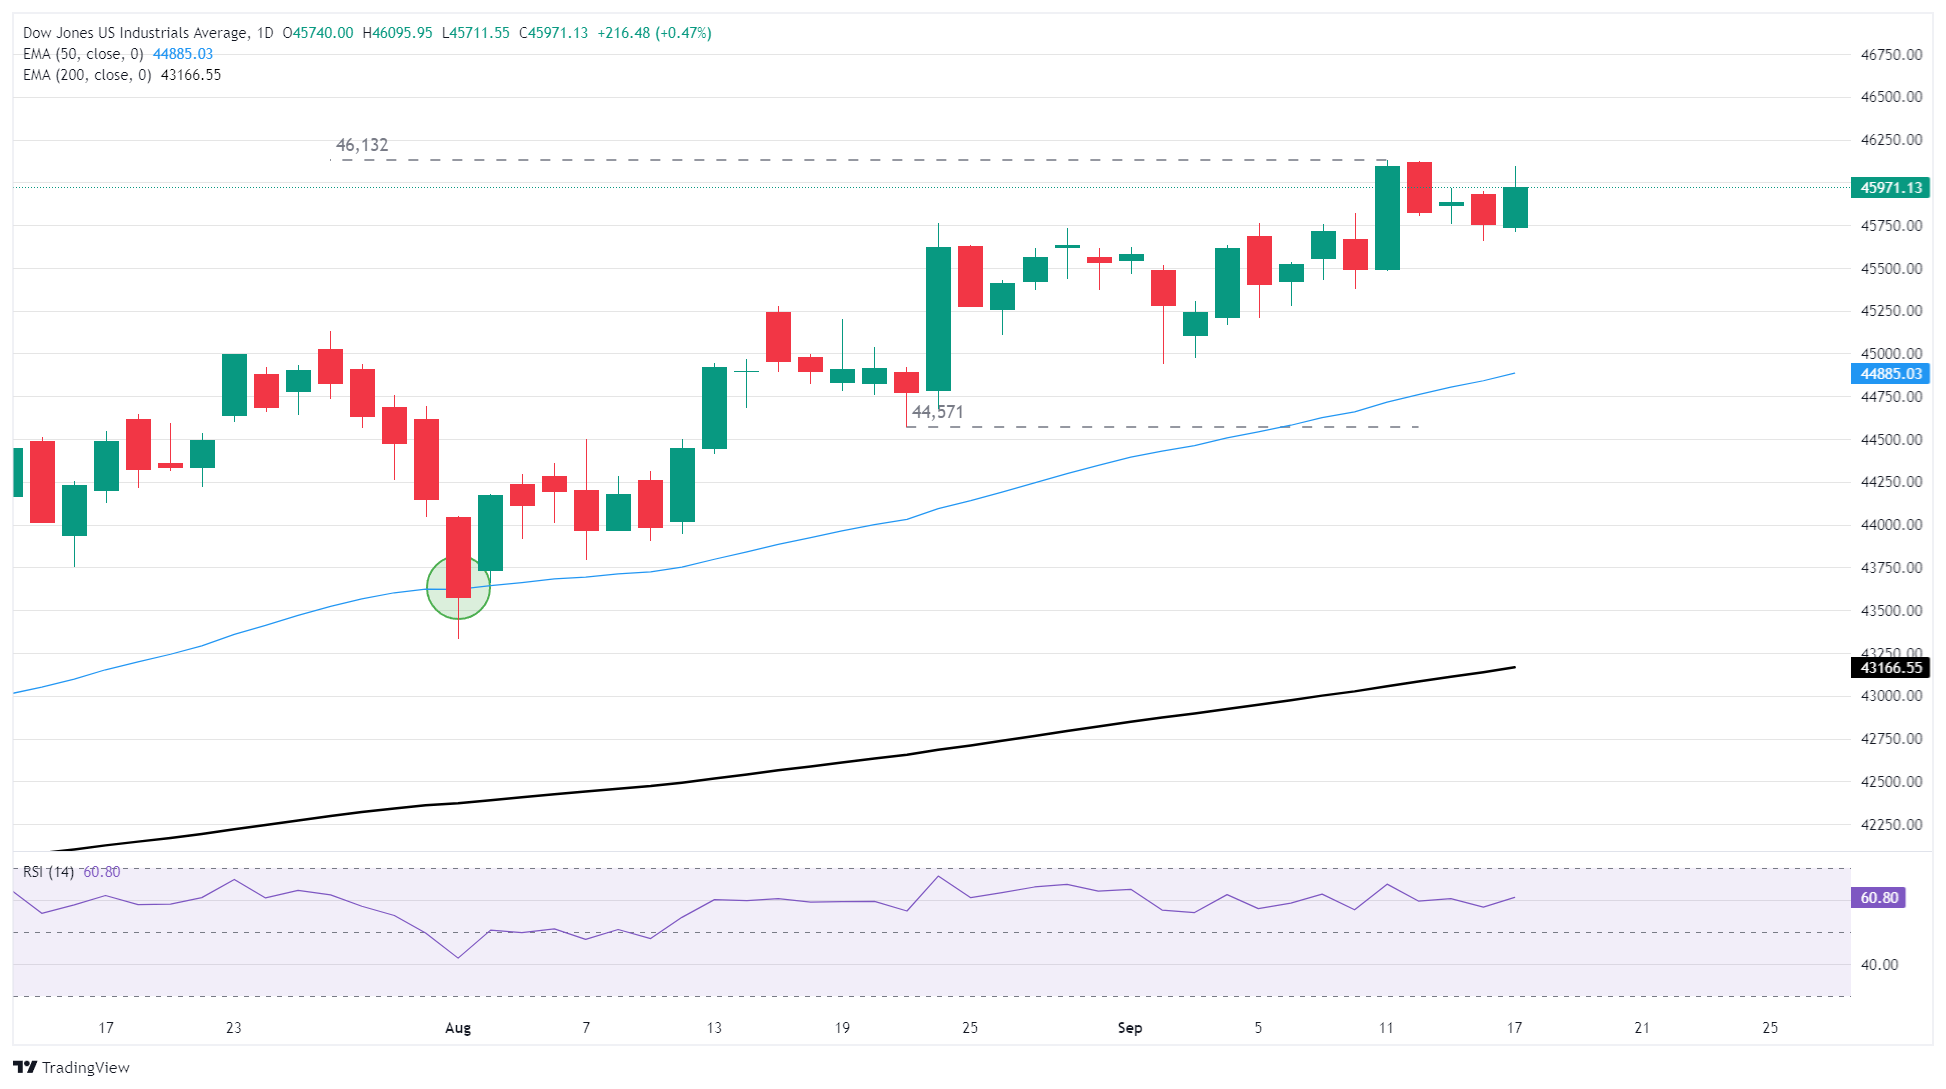
The Dow Jones Industrial Average (DJIA) found some room on the high side on Wednesday, with thin volumes bolstering the major equity index back into the 46,000 handle just ahead of the Federal Reserve’s (Fed) blockbuster interest rate call. The Fed is universally expected to deliver a 25-basis-point interest rate cut, with a thin margin for a 50-bps trim on the books.
Here comes the Fed
The Fed is overwhelmingly likely to meet markets in the middle and deliver a quarter-point cut on Wednesday as the employment side of the Fed’s mandate overtakes the US central bank’s price stability functions. US inflation, despite rotating into the higher side through the midpoint of 2025, still remains under control for the time being, and a steep drop-off in US employment figures has investors scrambling for interest rate cuts to hypothetically bolster investment lending and re-stoke hiring that has functionally stopped.
With a 25 bps rate trim functionally already a done deal, the key factor for investors will be the Fed’s stance on further rate cuts through the end of the year. Rate traders have priced in over 75% odds that the Fed will deliver three straight quarter-point cuts through the remainder of 2025, and markets will be looking for a measurably dovish shift in Fed Chair Jerome Powell’s upcoming post-rate-call press conference.
Rate cuts yes, but how many?
The Fed’s Summary of Economic Projections (SEP), or dot plot of policymakers’ interest rate expectations, also receives another update at this meeting and will have markets scrambling to see if Fed officials are leaning toward or away from the three straight expectations inked into rate futures.
Equities are overall higher in the pre-Fed hours, with megaretailer Walmart (WMT) rising 2.2% and climbing above $105.00 on expectations that lower rates will ease credit constraints on consumers, enabling Walmart customers to access deeper debt vehicles and continue purchasing goods and services at current income-to-cost ratios.
AI tech rally darling Nvidia (NVDA) took a swift hit early Wednesday, slipping 3% and falling below $170 per share after China’s government ordered their domestic companies to cease purchases of Nvidia chipsets. The AI death race to invest in deeper compute power continues on in the background, and China’s Nvidia ban comes just after Nvidia bent over backwards for the Trump administration, dedicating a portion of their revenues to obtain permission to sell restricted chipsets in Chinese markets.
Dow Jones daily chart
Dow Jones FAQs
The Dow Jones Industrial Average, one of the oldest stock market indices in the world, is compiled of the 30 most traded stocks in the US. The index is price-weighted rather than weighted by capitalization. It is calculated by summing the prices of the constituent stocks and dividing them by a factor, currently 0.152. The index was founded by Charles Dow, who also founded the Wall Street Journal. In later years it has been criticized for not being broadly representative enough because it only tracks 30 conglomerates, unlike broader indices such as the S&P 500.
Many different factors drive the Dow Jones Industrial Average (DJIA). The aggregate performance of the component companies revealed in quarterly company earnings reports is the main one. US and global macroeconomic data also contributes as it impacts on investor sentiment. The level of interest rates, set by the Federal Reserve (Fed), also influences the DJIA as it affects the cost of credit, on which many corporations are heavily reliant. Therefore, inflation can be a major driver as well as other metrics which impact the Fed decisions.
Dow Theory is a method for identifying the primary trend of the stock market developed by Charles Dow. A key step is to compare the direction of the Dow Jones Industrial Average (DJIA) and the Dow Jones Transportation Average (DJTA) and only follow trends where both are moving in the same direction. Volume is a confirmatory criteria. The theory uses elements of peak and trough analysis. Dow’s theory posits three trend phases: accumulation, when smart money starts buying or selling; public participation, when the wider public joins in; and distribution, when the smart money exits.
There are a number of ways to trade the DJIA. One is to use ETFs which allow investors to trade the DJIA as a single security, rather than having to buy shares in all 30 constituent companies. A leading example is the SPDR Dow Jones Industrial Average ETF (DIA). DJIA futures contracts enable traders to speculate on the future value of the index and Options provide the right, but not the obligation, to buy or sell the index at a predetermined price in the future. Mutual funds enable investors to buy a share of a diversified portfolio of DJIA stocks thus providing exposure to the overall index.
Author

Joshua Gibson
FXStreet
Joshua joins the FXStreet team as an Economics and Finance double major from Vancouver Island University with twelve years' experience as an independent trader focusing on technical analysis.


